
Charts for binary options
The easiest and most expedient method in graphical analysis of the binary options market is visual observation of the market and analysis of charts of options dynamics, or in other words, a graphical representation of price movement. This principle uses technical analysis of financial markets.
If you draw the price movement in the form of a chart using only simple lines, the graphical representation will be incorrect, because each time interval on the price chart includes four types of prices at once: the highest and, on the contrary, the lowest price for opening a position and closing. It is impossible to depict such a data set, since a graph of simple functions is used during trading, while only one value of the function corresponds to any time interval.
In such cases, to reflect the formation of prices in binary trading, other types of charts are usually used, which are a little more complicated than a simple broken line. These charts on the market are called charts (from the English term Forex chart).
Read the article in order to get full information on charts for binary options:
Options chart or options live chart
Real-time chart
How to Use a Real Chart for Binary Options
Choosing a Binary Asset
A live binary options chart is designed to predict the movement of an asset. Therefore, first we need to choose the asset with which we will work. You can choose currency, stocks, raw materials and other financial instruments. The asset selection is located in the left corner of the chart:

Attention: currency pairs are more popular for binary options
Setting up time parameters (Time frames)
Depending on the binary strategy, it is necessary to choose the time parameters for trading or, as traders also call them, the timeframe. To change the time tinctures, click on the down arrow:
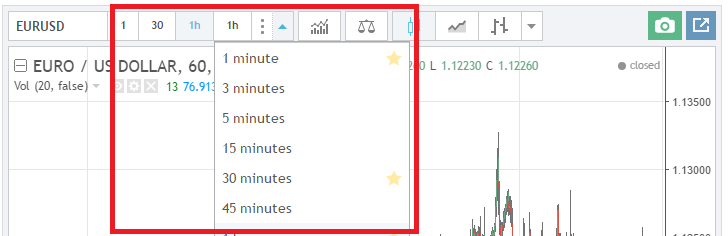
Note: the timeframe is determined by the binary options strategy.
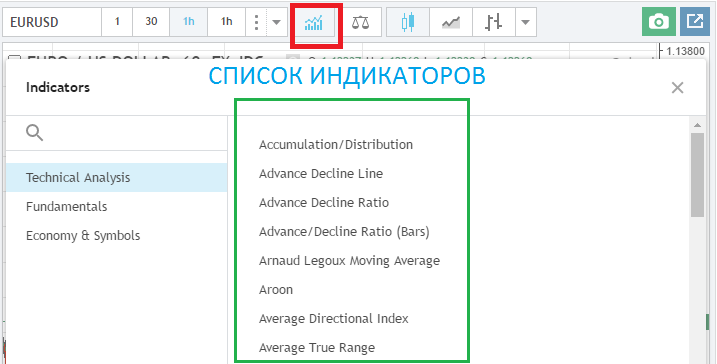
Selection of indicators
It is impossible to predict the movement of an asset without using binary options strategies. Strategies are most often based on the analysis of the chart of the price movement of an asset using binary options indicators. Binary indicators work with mathematical functions that show the price movement in graphical form. To select an indicator, click on the icon in the top menu, as shown in the figure. You can immediately configure the indicator parameters:
Live Chart is a feature-rich charting platform for binary options trading. It must be remembered that the main point in trading is the choice of strategy.
Tools for analyzing and predicting the price movement of a binary option
How to work with options charts?
Working with binary options charts is divided into three main steps. Since the basic rule for profitable trading is to plan, follow a plan, the most important thing to start working with a binary chart is to define a strategy. The binary options strategy determines how and what we trade, what tools to use to analyze and predict the movement of an asset. After you have decided on a binary options strategy, you must:
- Choose an asset to trade,
- Set time parameters according to the binary strategy,
- Install binary options indicators.
START MAKING MONEY WITH HONEST BROKERS NOW
| Брокер | Бонус | Мин. депозит | Доходность | Регуляция | Обзор | Открыть счёт |
|---|