
Options Chart

The main tool for analyzing and predicting the direction of a market or asset is options charts . Technical analysis is based on identifying patterns in market behavior. Identifying pivot points, trend, resistance and support levels requires knowledge to work with live binary options charts . Only on the chart can you use graphical analysis of the market. At the very beginning, let’s figure out what a graph is and how it is built.
The chart shows the price level at
a certain time. With a change in the time frame, you can build a chart based on the price change for a certain period. These price levels can be shown by several types of charts.
In this article, you will find everything you need to know to work with binary options charts. How to set up and how to read the information obtained using graphs.
- Types of Binary Options Charts
- Asset Selection
- Choosing a trading time period
- Choosing a Binary Indicator
Types of Binary Options Charts
There are four main types of charts for technical analysis of the financial market. Each chart displays the price-to-time function. The use and choice of the option chart depends on the chosen binary strategy.
The charts show four main parameters: Open price, close price, high, low for a certain time period.
Types of binary options charts:
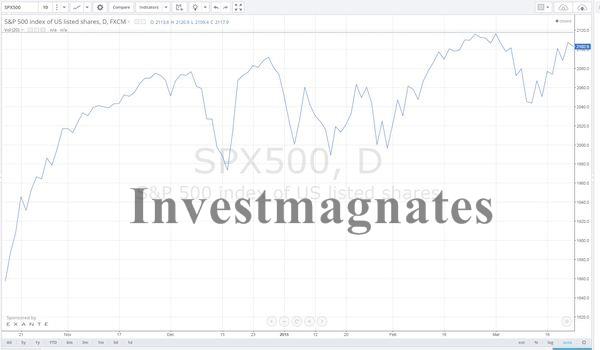
- A line chart is a price chart on which points depicting data or prices are marked at regular intervals. The connection of the dots forms a price chart of options, displayed linearly. The chart shows the price of the asset at each time interval.
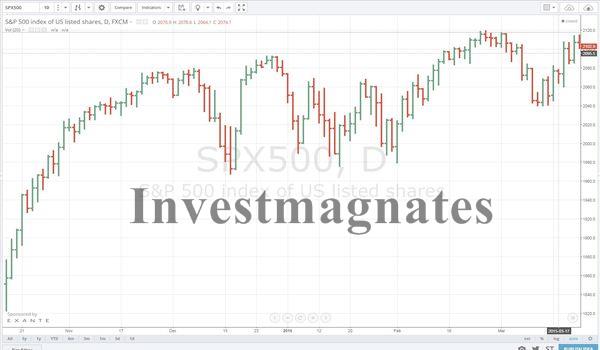
- Bar chart – this options chart shows all four prices at once. For a certain period of time: open/close/min/max .
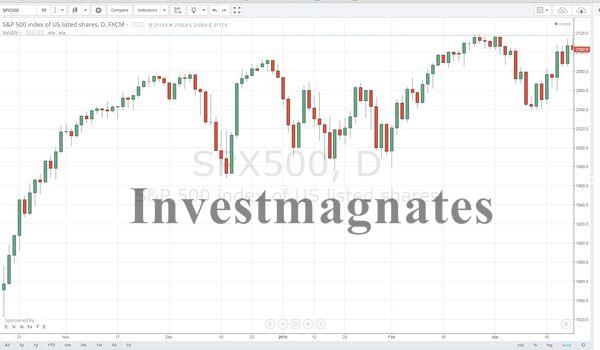
- Candlestick chart (Japanese candlestick chart) – the chart is similar to the bar chart, it also shows four price values. The difference between these two graphs is the visual display. The options candlestick chart is the most popular. Since there is Candlestick analysis, which is very popular among traders.
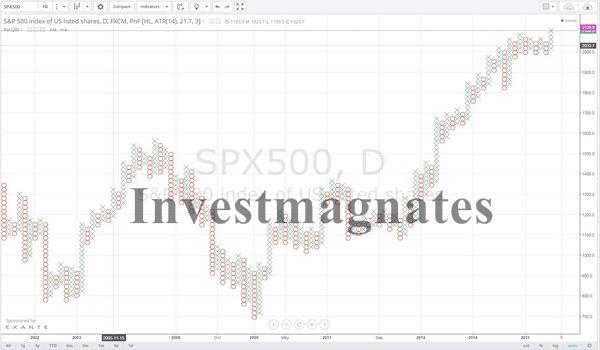
- The tic-tac-toe chart is a type of chart of quotations of a trading object (commodity, security, currency) used in technical analysis, which displays price changes in the form of vertical columns consisting of crosses (“X” – symbolizes growth) or zeros (“0” – symbolizes decline). A specified upward movement of the price (for example, every 10 points) is marked by adding a cross to the column, and a downward movement is marked by a zero. The point-to-digit chart takes into account the direction and magnitude of the price change, but does not depend on the duration of such a change in time. This type of chart is extremely difficult to combine with trading volume indicators, since they will be summed up for the entire period of growth or decline (for one column), and not refer to a specific period (column element)
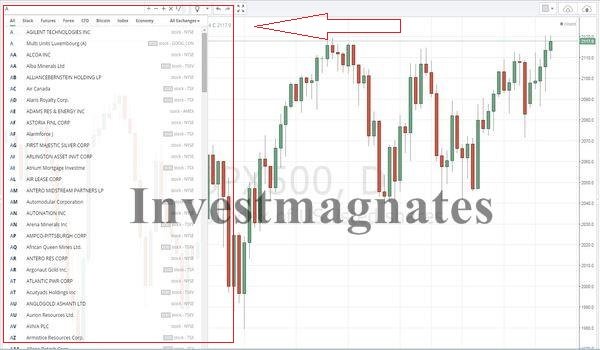
Choosing an Asset/Binary Option
A chart for binary options trading shows the movement and change in the price of several assets. In the upper left corner you will find a ruler with assets. After you have selected an asset from a broker, find it on the chart and you will be able to fully analyze the option and predict its movement.
Assets can be: Stocks, Currencies, CFDs, Indices, Commodities
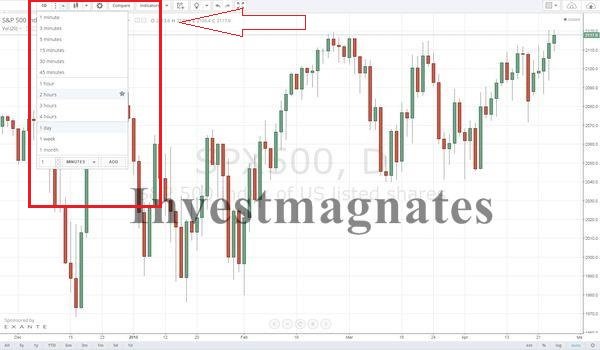
Choosing a trading time period
On the tool ruler, you can select the time interval for the binary chart. The definition of time intervals depends on the binary strategy you want to trade. The shorter the time period, the faster you will see the price change.
Choosing a Binary Indicator
To determine the movement and on a full analysis of a binary asset, binary options indicators are used. Each indicator has its own purpose. It can Trend Indicators Binary options, to determine the direction prices, or volume indicators to determine the interest of traders in a given asset.
The set of indicators is determined by the binary options strategy. It is necessary to avoid the use of indicators with the same indicator. Since you won’t get the right signal.

To develop your binary strategy, read the article: How to develop a binary options trading strategy.