
Relative Strength Index (RSI) indicator
Description
We continue the series of detailed reviews of binary options oscillators on the INVESTMAGNATES.COM portal. When you are just starting to get acquainted with trading, it is important to have reliable and useful material that can be used in practice. For your productive learning, we publish our reviews of technical indicators, talk about their features, how to use expiration correctly, and get a stable income. Today we will talk about one of the most common trading tools – the RSI indicator.
The Relative Strength Index ( RSI) indicator is a popular technical oscillator that tracks the relative changes between the indicators of higher and lower prices over a specific period of time. It was developed by the trader J. Wallace Wilder, creator of the famous Parabolic SAR. For the first time, the new instrument was learned in June 1978 in the magazine Commodities, then it was published in the author’s book “New Concepts of Technical Trading Systems” and since then has become one of the most popular oscillators.
The Relative Strength Index works by comparing the magnitude of the price rises of an asset over the last time interval with the magnitude of its falls and shows this material using numbers ranging from 0 to 100. Interestingly, of all the oscillators widely used in practice, it is the RSI that best corresponds to the main methods of technical analysis: the presence of trend lines, support and resistance levels.
The use of this data in combination with overbought/oversold levels, as well as divergence signals , provides valuable insight into the dynamics of market processes. The tool will help you understand the current forces of the market, based on them to make the right decision.
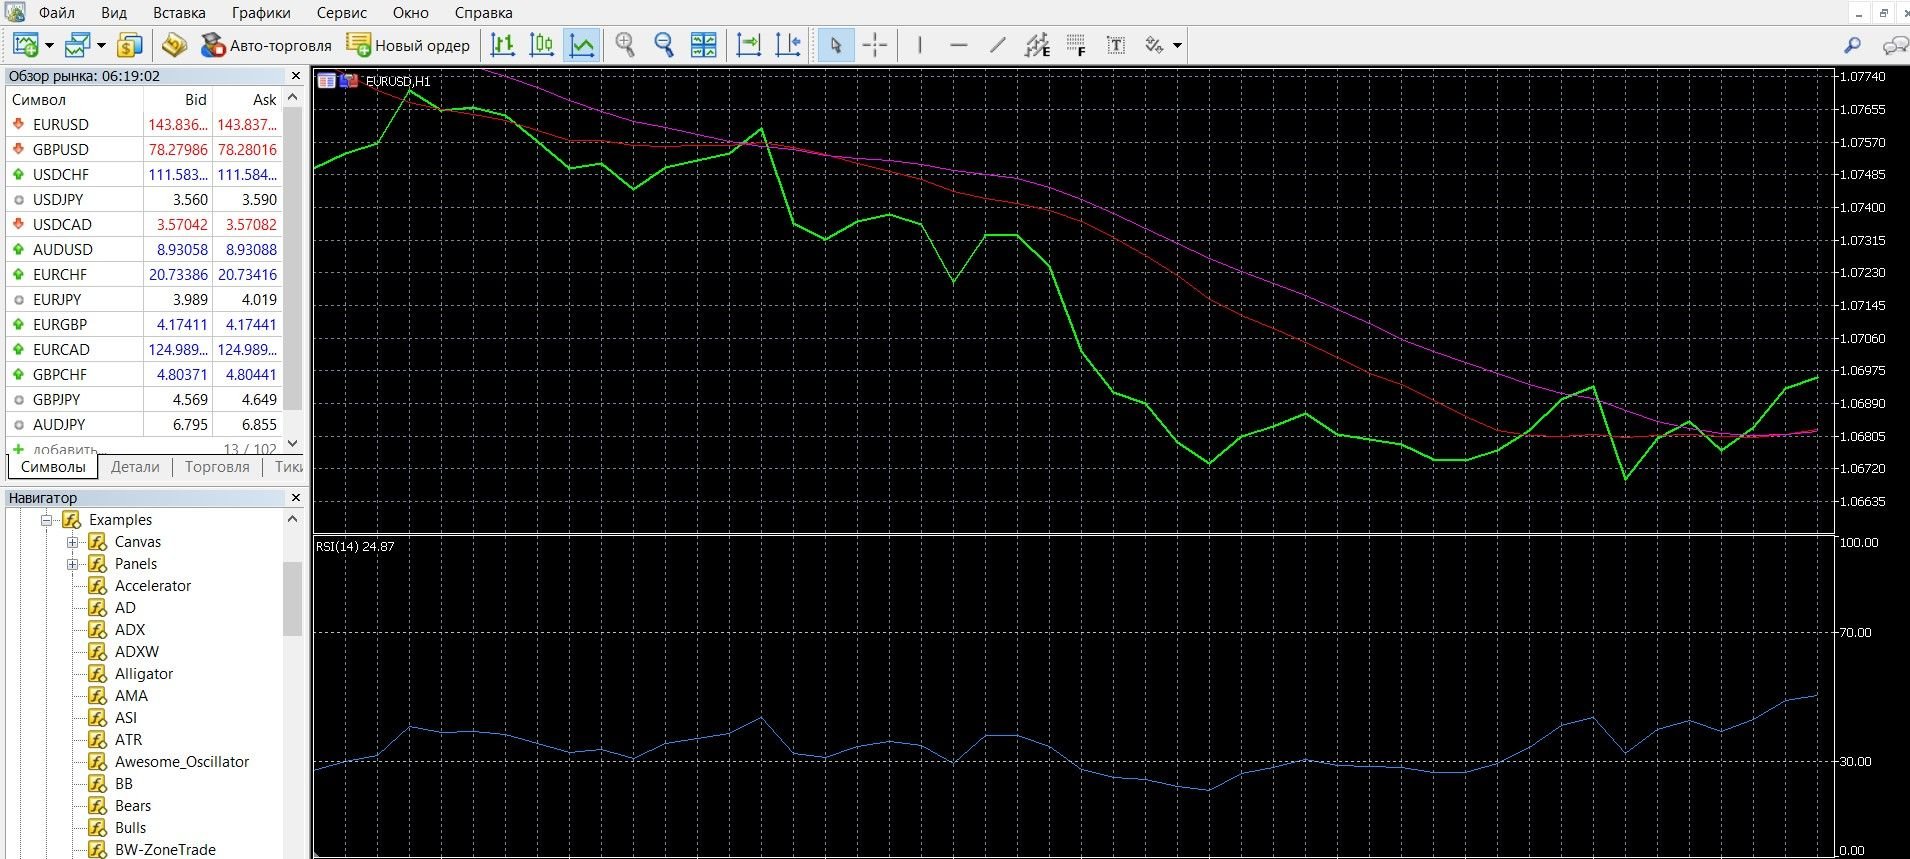
You can see how the RSI visually looks on the MetaTrader 4 (MT4) platform in the image below. In addition, you can download the MetaTrader 4 platform and get acquainted with the oscillator in practice.
How does the RSI indicator work?
Today, RSI is a multifunctional indicator that is recommended to be used to identify price dynamics, the level of purchase / sale. RSI gained popularity due to its simplicity and clear signals. The oversold zone is at 30 and below, the overbought zone is at 70 and above.
To collect the material, the relative strength index uses past data, i.e., the Relative Strength Index. shows the strength of the change relative to itself, displays the “momentums” – the speed and amplitude with which the price movement occurs. So, with the help of RSI, you can analyze the strength or weakness of the current state of the market.
As a result, it is used for futures, options, indices, currency pairs. A useful property of the indicator is that its reversals at the tops and bottoms are formed in advance than the reversals of the price chart. This allows the trader to open trades in advance with the least risks.
RSI Indicator Signals
Overbought/oversold signals:
- If the value is 70, we have an overbought zone in front of us, this is a signal to sell a PUT option;
- If the value is 30, we have an oversold zone in front of us, this is a signal to buy a CALL option.
Signals of crossing the center line:
- If the indicator crosses point 50 when moving upwards, this is a signal to buy a call option;
- If the indicator crosses point 50 when moving downwards, this is a signal to sell a PAT option.
Divergence signals:
- Divergence occurs if the price high is not confirmed by the RSI chart data, it is worth buying a CALL option;
- Convergence occurs if the price low is not confirmed by the RSI chart data, it is worth buying a put option.
Calculation formula:
RSI = 100 – (100 / (1 + U / D)), where:
U is the average value of positive price changes;
D is the average value of negative price changes.
Info taken from www.metatrader5.com website
Do you need to install RSI in your platform?
The RSI indicator is a classic technical analysis tool , it is included in most modern trading terminals, it is also available on the popular MetaTrader 4 platform.
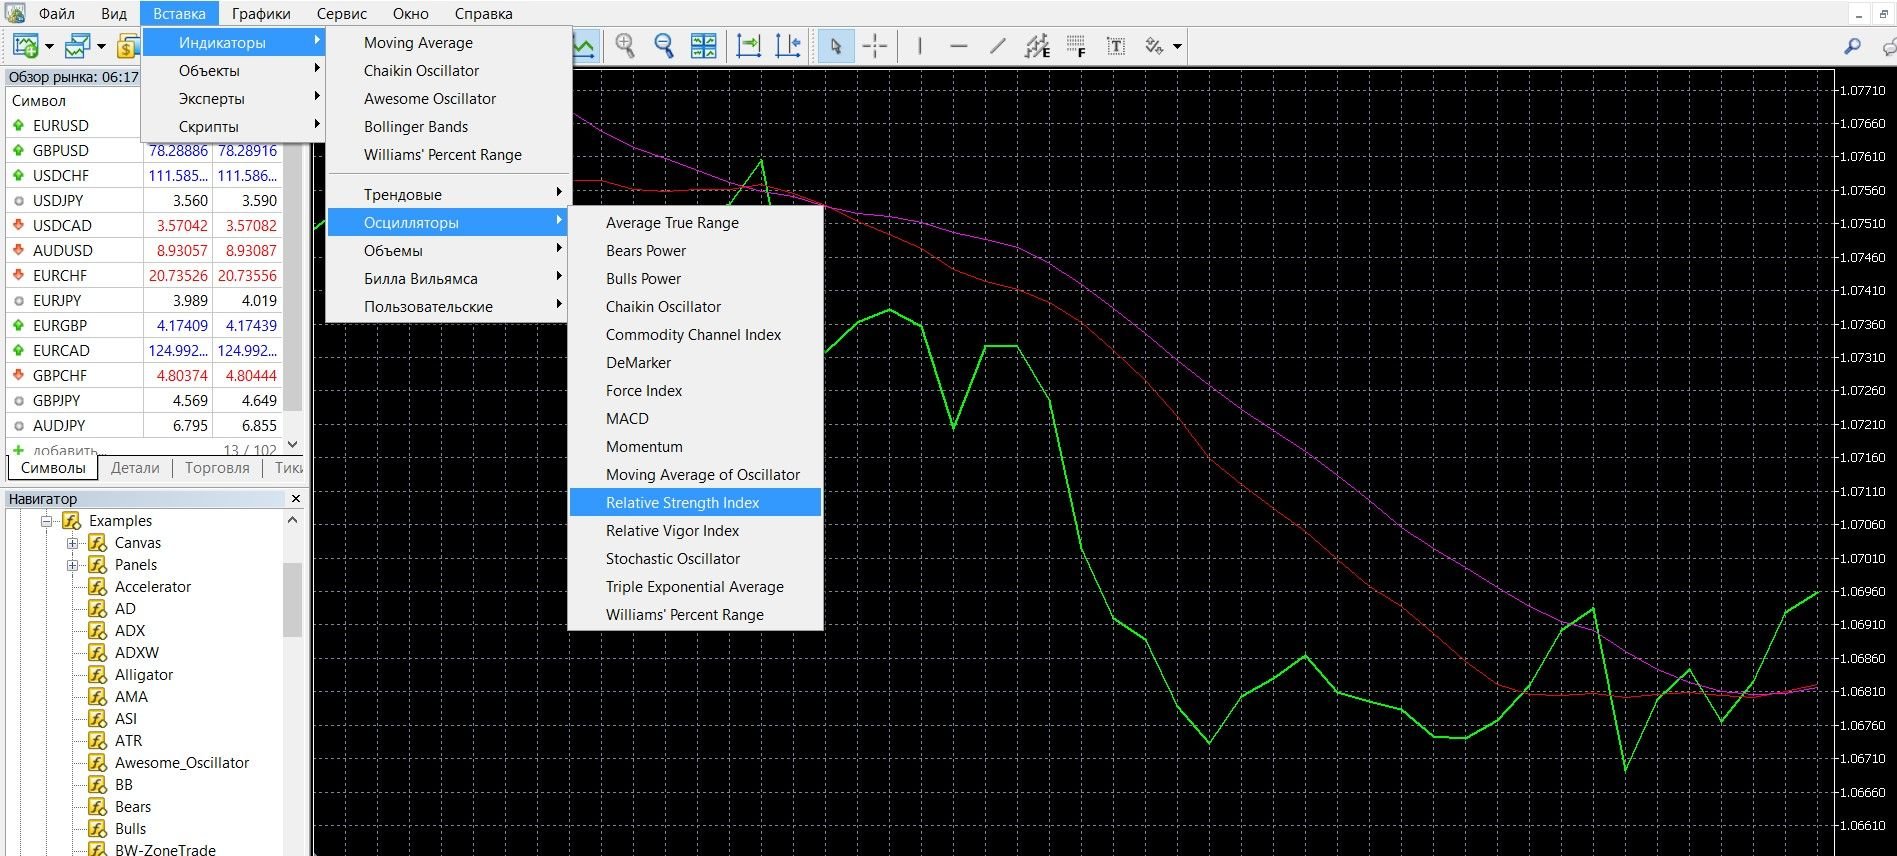
To add an oscillator to the price chart, take the following steps:
- Click the “Insert” tab in the top menu of the platform
- Select the tab “Indicators” – “Oscillators”
- In the drop-down menu that opens, select “RSI”. The indicator is added to the chart, you can work.
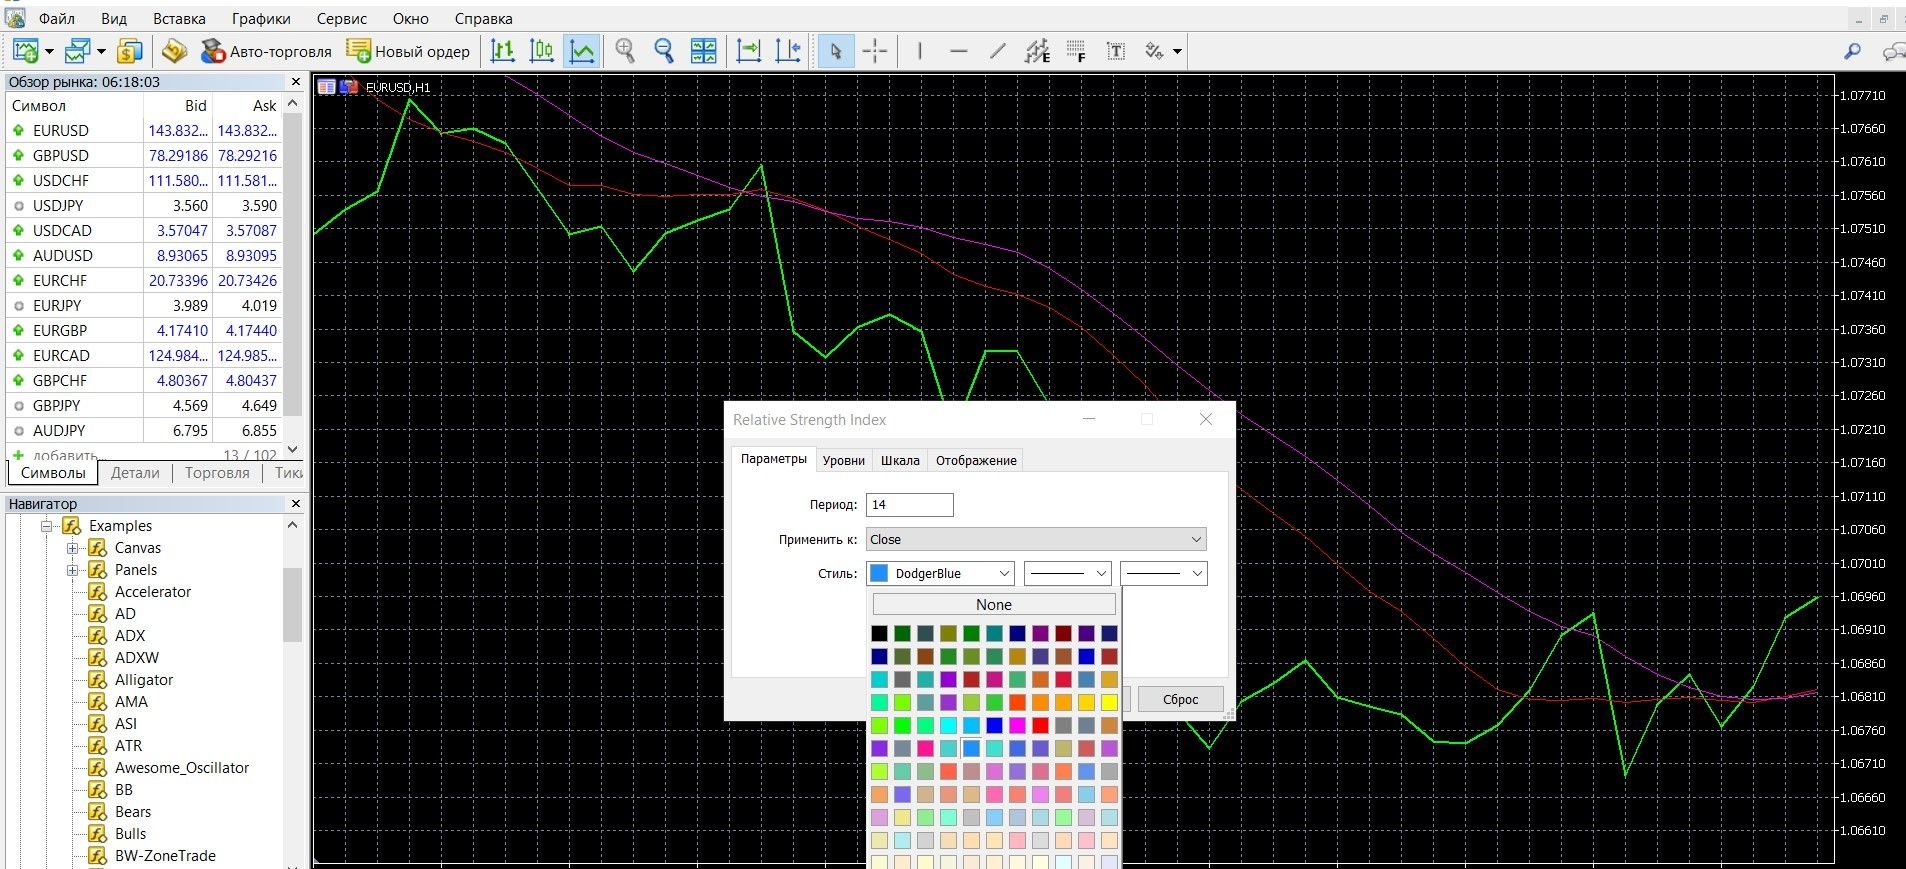
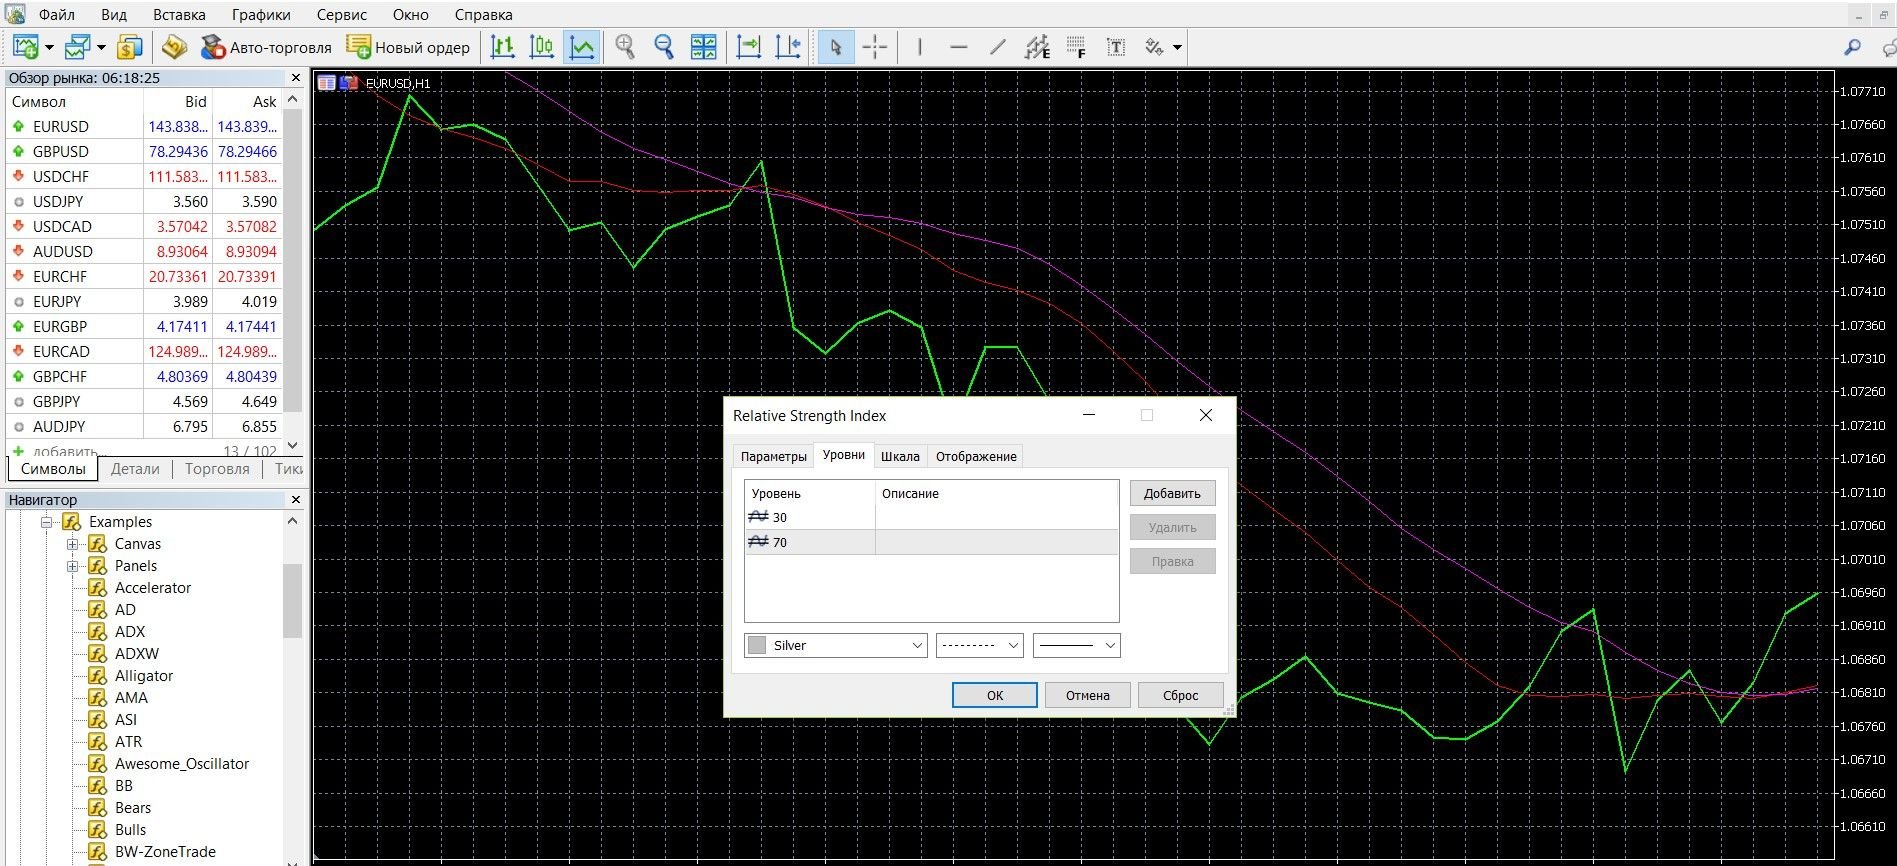
When you add an indicator, a window with settings will automatically open, where you can change the indicator of the calculation period. As a standard, a period of 14 is indicated here. The author of the indicator recommended using the 14-period variant, later the 9 and 25-period indicators were also used.
You can also find and apply your metrics for a specific strategy. By changing the parameter of the calculation period, you change the sensitivity of the instrument: as the indicator increases, the frequency of the indicator entering the overbought-oversold zone decreases; With a decrease in the indicator, there is an increase in the frequency of hitting these zones. In the Style tab, you can work with the indicator style settings.

If your platform doesn’t have an indicator, download it here.
Application of the indicator for binary options
As mentioned above, the Relative Strength Index (RSI) is one of the most popular indicators in trading. It shows how much the price has changed in the direction of its movement; Then transforms the price into a percentage, indicating profitable places to buy (below 30%) and sell (above 70%).
Like Stochastic, the RSI signals where the price is at the moment relative to past prices. In binary options, it is widely used to determine the dynamics of the market and the strength of the trend (upward or downward), to predict the movement of quotes. It also works great as an additional filter in trading strategies.
RSI is a leading indicator, because Its highs and lows signals are ahead of the data on the main price chart. This is very convenient for traders and helps to quickly make the right decision about the forecast.
Also, the main signals of the transaction are the exit from the oversold-overbought zone, divergence and convergence. Remember that, like other oscillators, the RSI gives false signals during a strong trend. When deciding on a trade, use additional signals and indicators.
Rules for concluding transactions (screenshots)
Trading with overbought/oversold signals
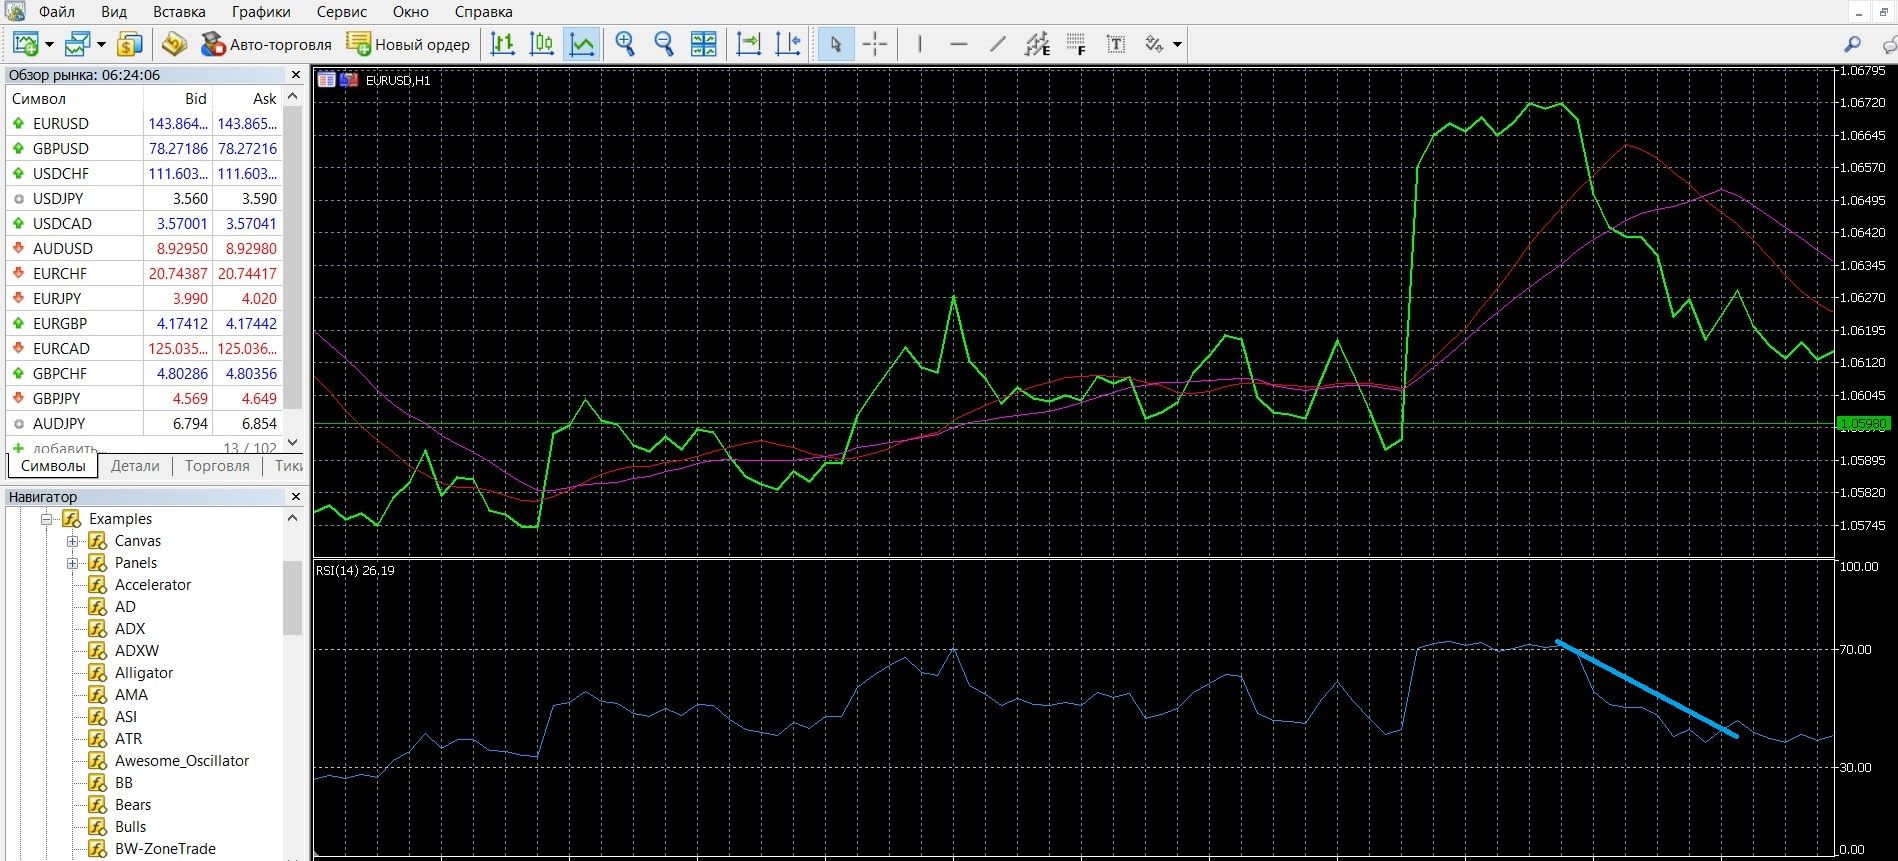
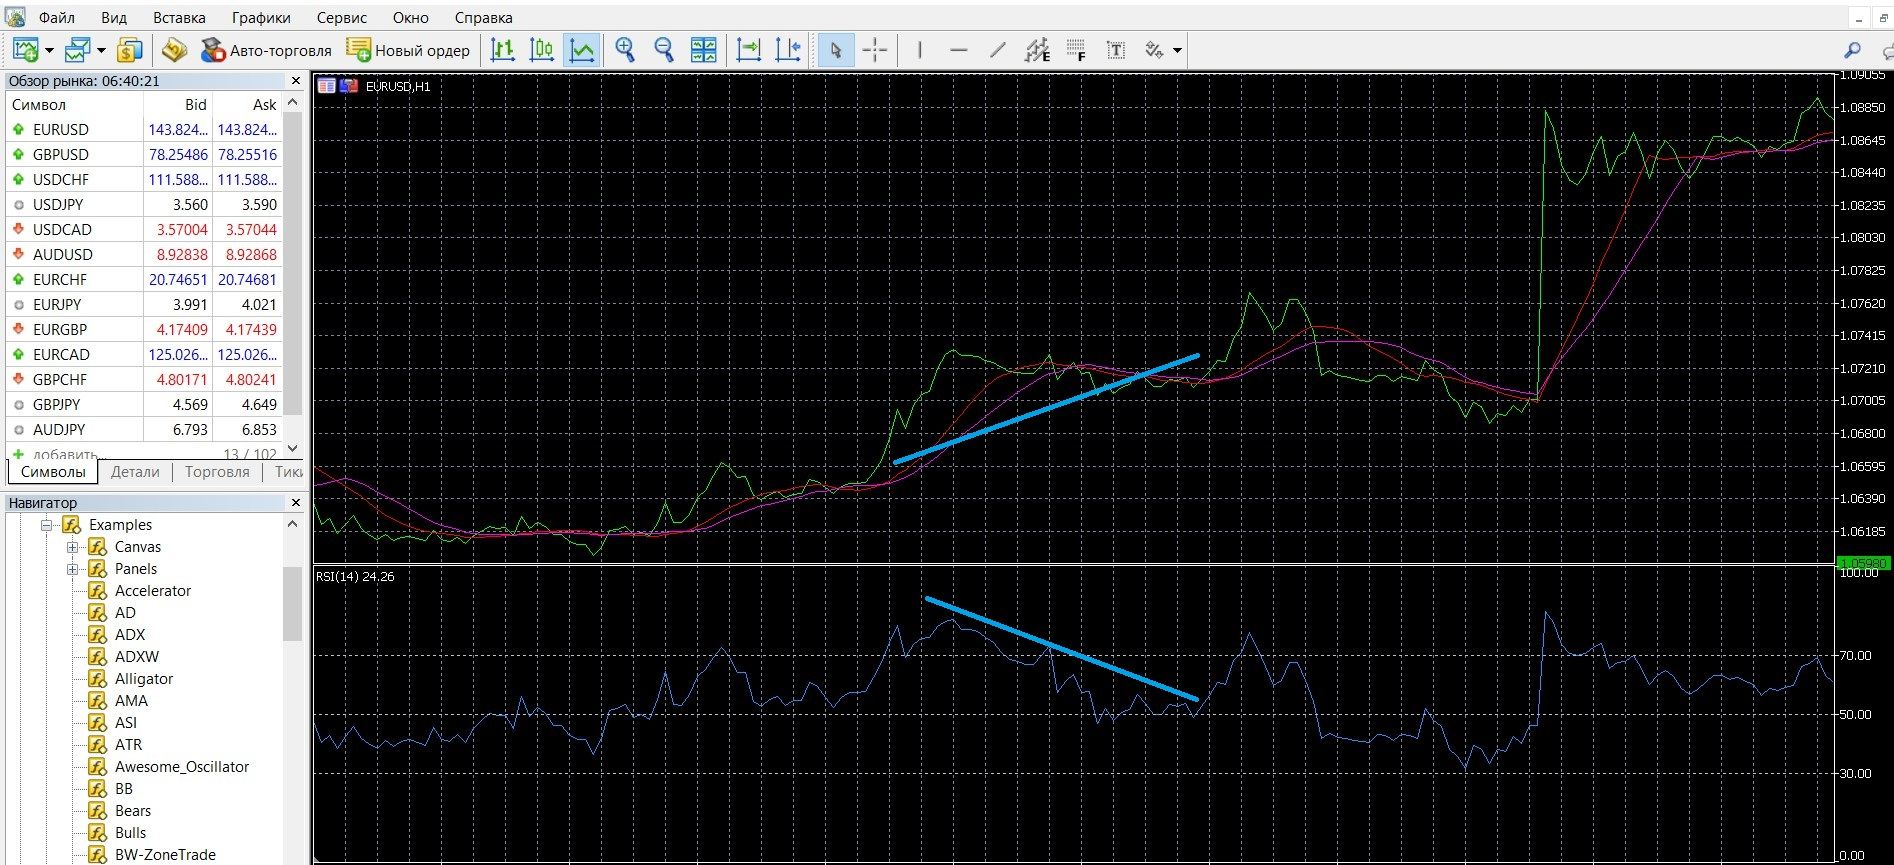
If the value of the indicator lines is 70, we have an overbought zone in front of us, this is a signal to sell a PUT option. In the image below, you can observe the downward trend of the market on the MetaTrader 4 platform:
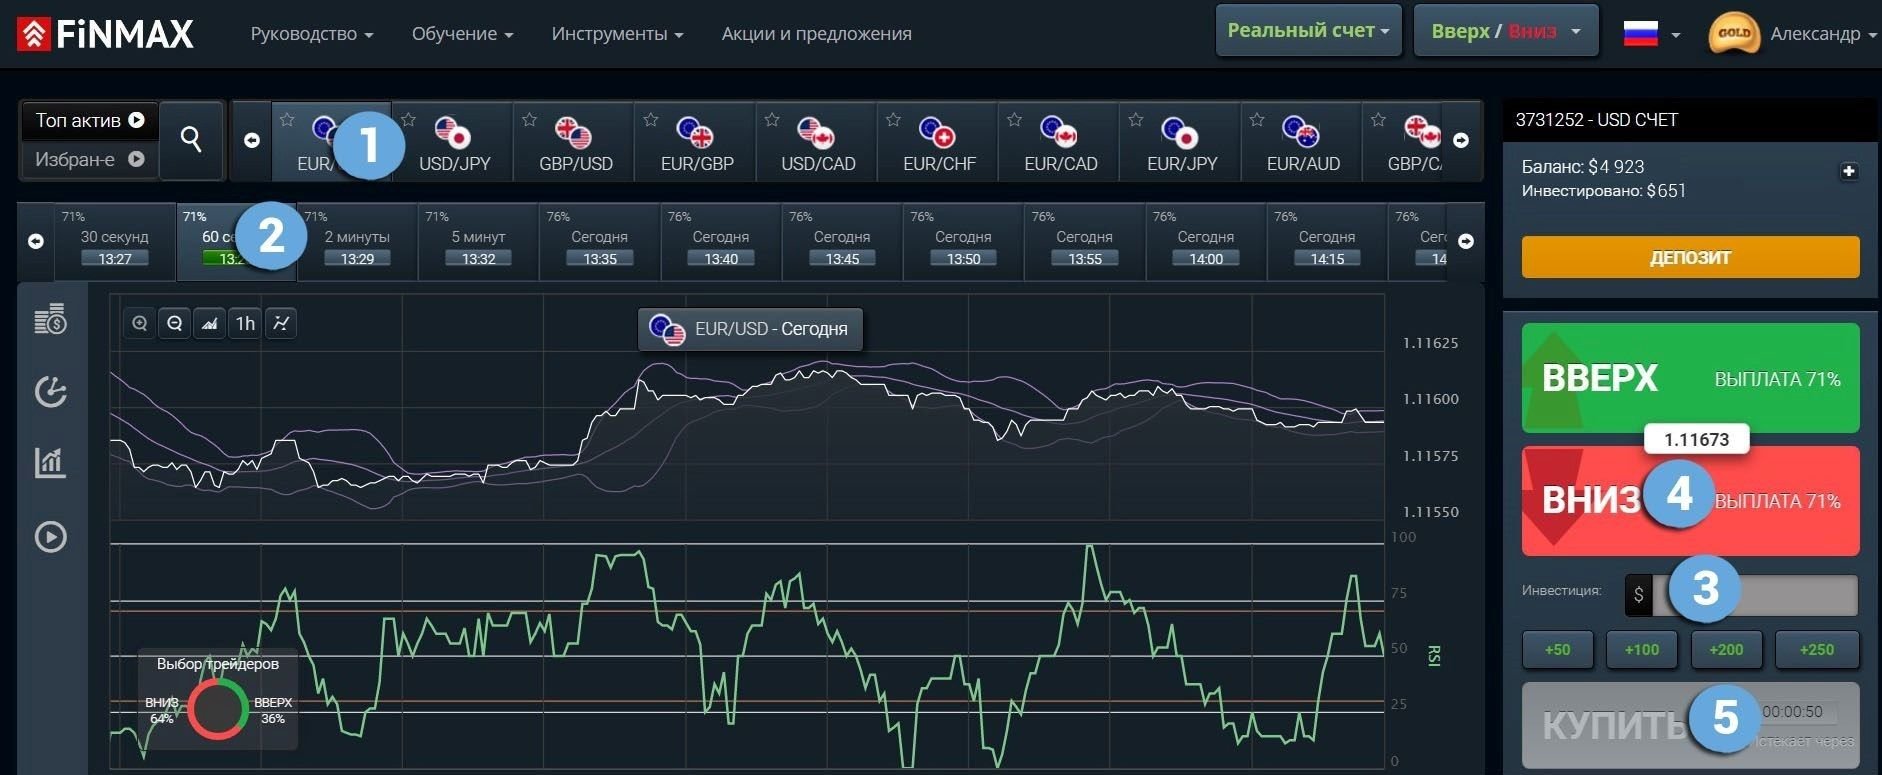
Take advantage of the downtrend and place a PUT (down) rate with the Finmax broker. To do this, go to the broker’s website finmaxbo.com and prepare an option for trading, indicating:
- Type of option
- Expiration dates
- Bet amount
- Movement forecast: DOWN
- Click the “buy” button and wait for the results.
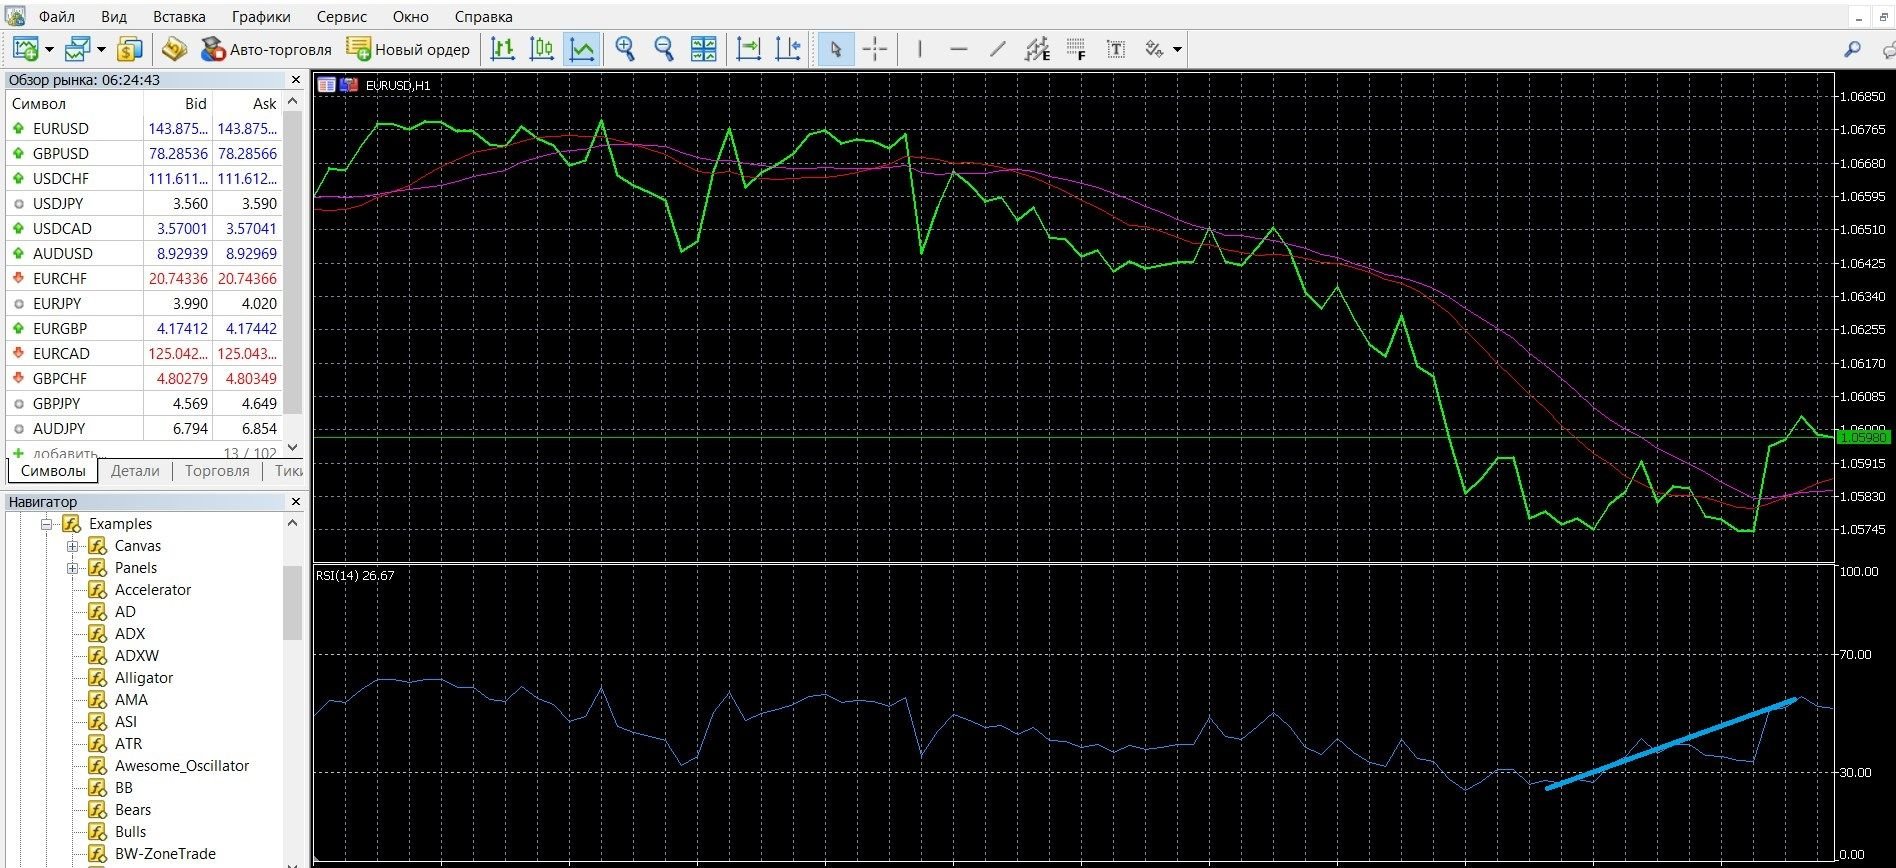
If the value of the indicator lines is 30, we have an oversold zone in front of us, this is a signal to buy a call option. In the image below, you can observe the upward trend of the market on the MetaTrader 4 platform:
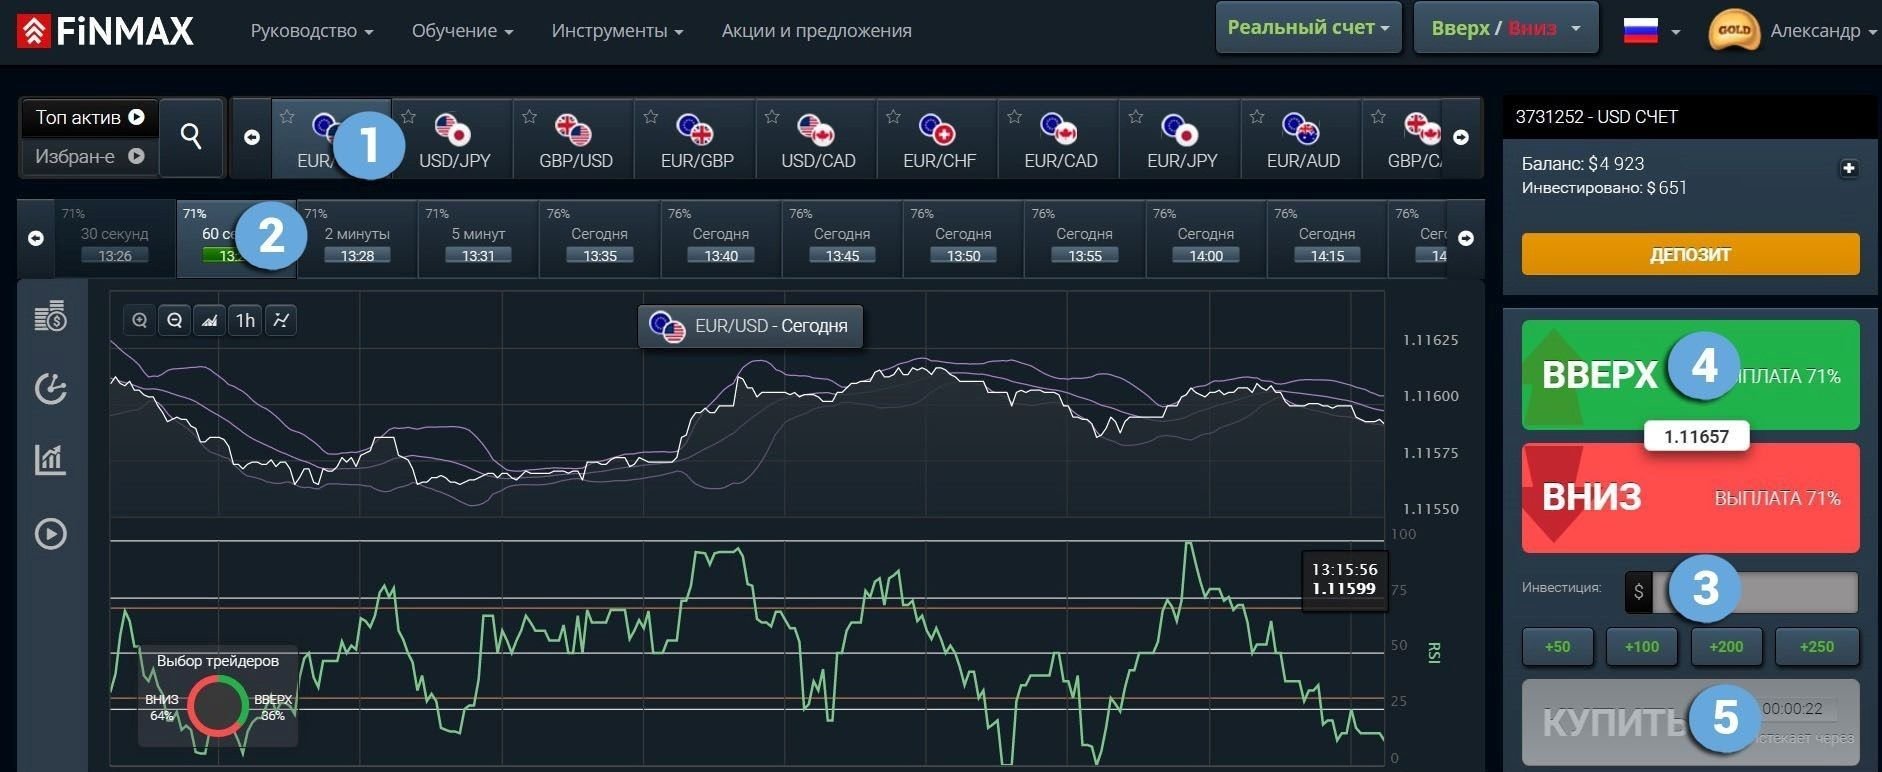
Take advantage of the uptrend and place a CALL ( up) rate with the Finmax broker. To do this, go to the broker’s website finmaxbo.com and prepare an option for trading, indicating:
- Type of option
- Expiration dates
- Bet amount
- Movement forecast: UP
- Click the “buy” button and wait for the results.
Trading with signals of crossing the center line
If the indicator crosses point 50 when moving up, it is a buy signal. In the image below, you can observe the upward trend of the market on the MetaTrader 4 platform:
Take advantage of the uptrend and place a CALL ( up) rate with the Finmax broker. To do this, go to the broker’s website finmaxbo.com and prepare an option for trading, indicating:
- Type of option
- Expiration dates
- Bet amount
- Movement forecast: UP
- Click the “buy” button and wait for the results.
If the indicator crosses point 50 when moving down, it is a sell signal. In the image below, you can observe the downward trend of the market on the MetaTrader 4 platform:
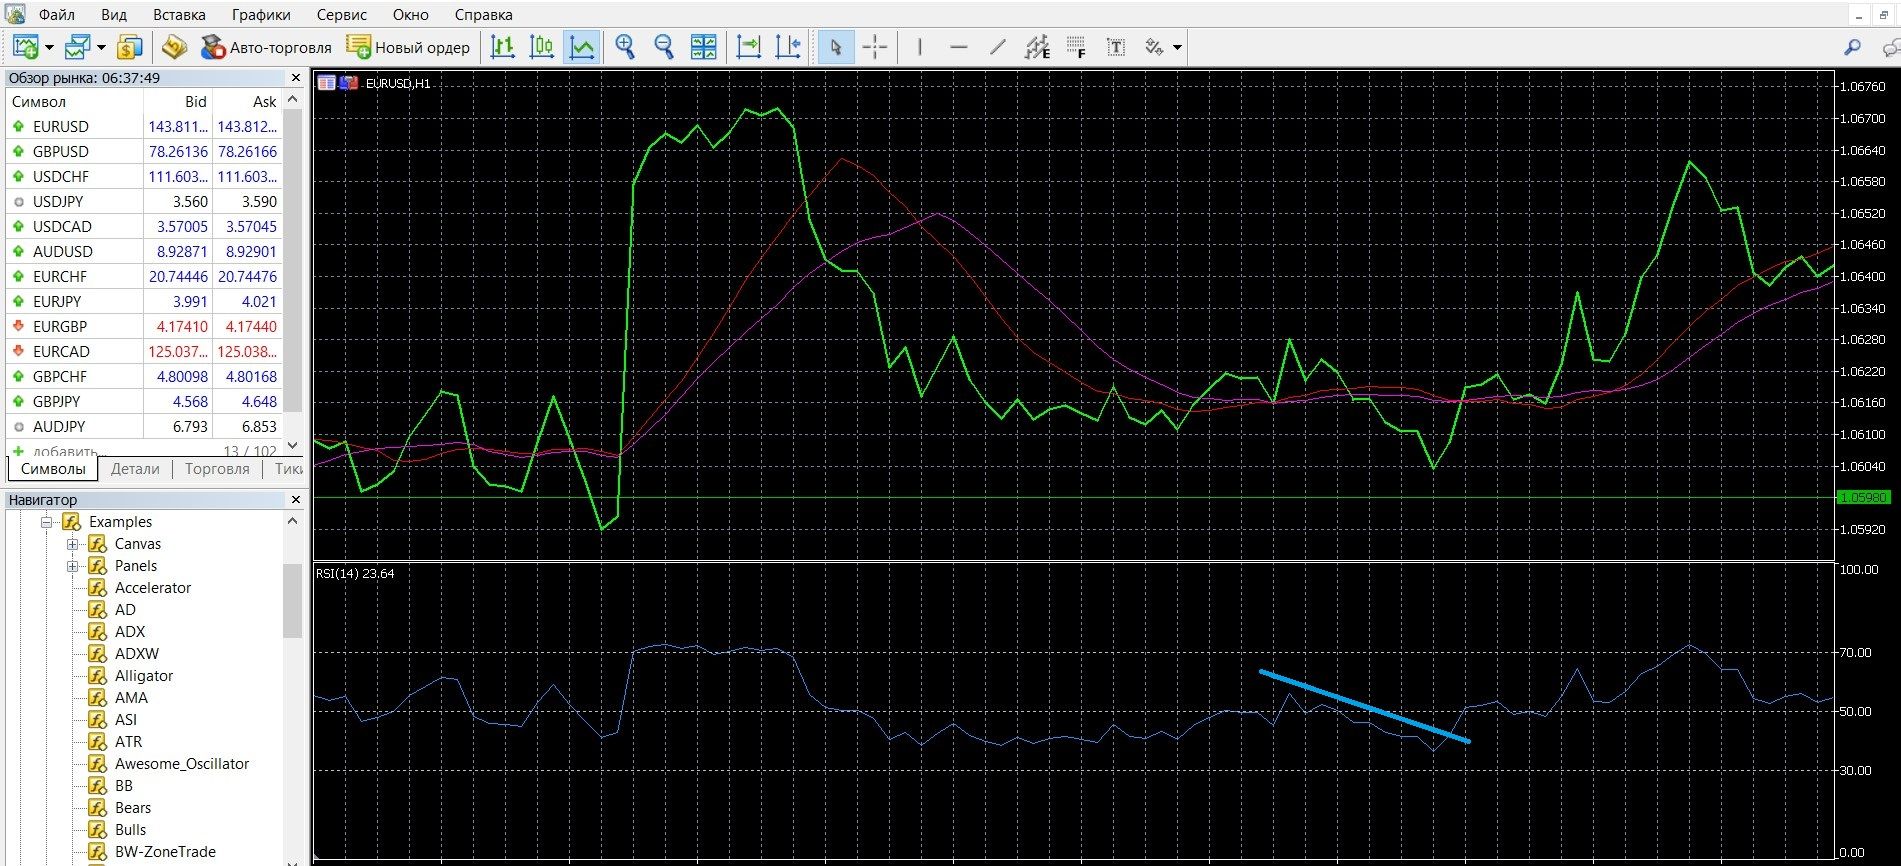
Take advantage of the downtrend and place a PUT (down) rate with the Finmax broker. To do this, go to the broker’s website finmaxbo.com and prepare an option for trading, indicating:
- Type of option
- Expiration dates
- Bet amount
- Movement forecast: DOWN
- Click the “buy” button and wait for the results.
Trading with divergence signals
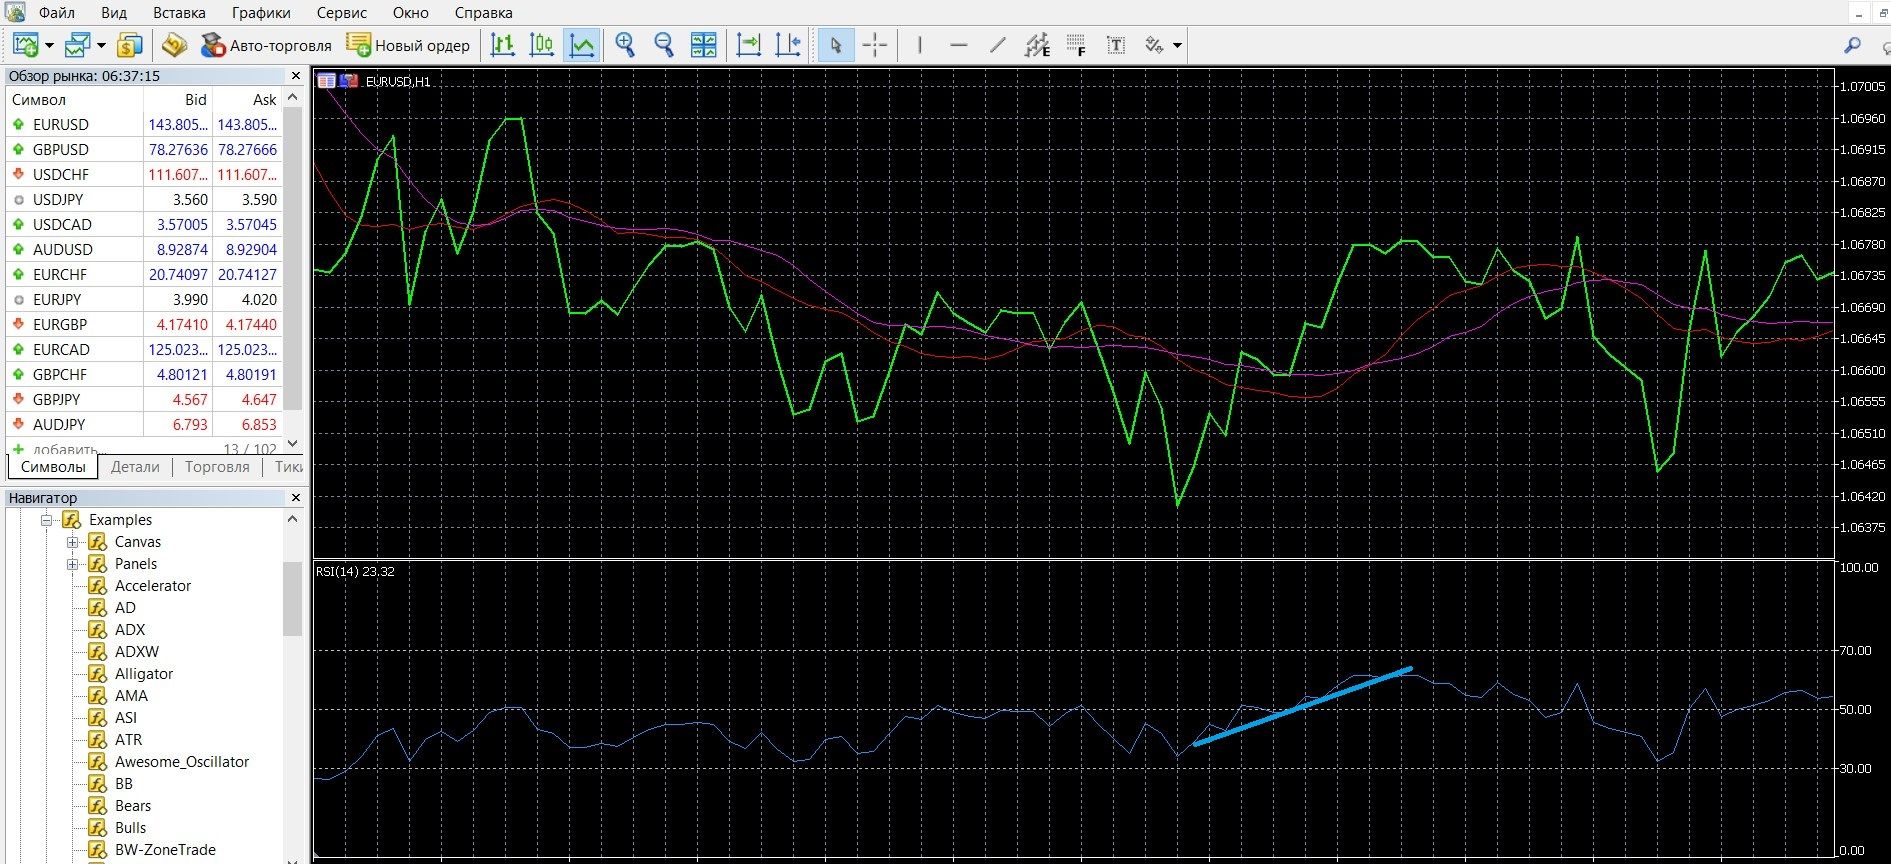
A divergence signal occurs if the high price is not confirmed by the RSI chart data. In the image below, you can observe the market divergence signal on the MetaTrader 4 platform:
Take advantage of the divergence signal and place a CALL ( up) bet with the Finmax broker. To do this, go to the broker’s website finmaxbo.com and prepare an option for trading, indicating:
- Type of option
- Expiration dates
- Bet amount
- Movement forecast: UP
- Click the “buy” button and wait for the results.
A convergence signal occurs when the price low is not confirmed by the RSI chart data. In the image below, you can see the convergence on the MetaTrader 4 platform:
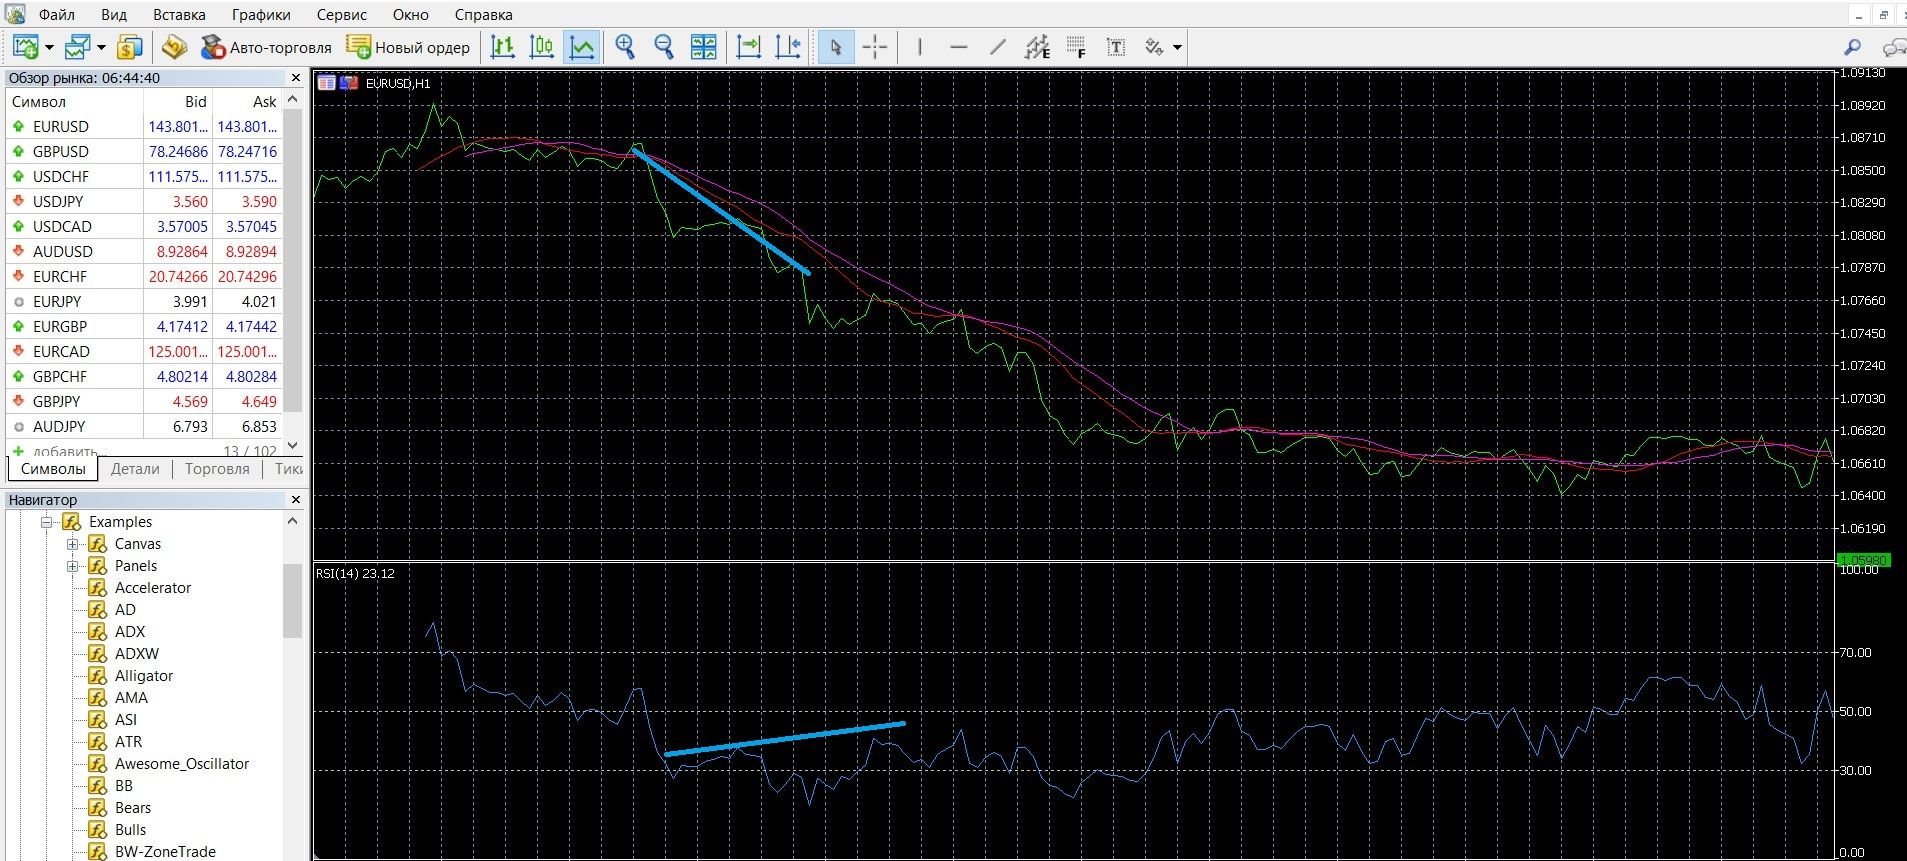
Take advantage of the convergence signal and place a PUT (down) rate with the Finmax broker. To do this, go to the broker’s website finmaxbo.com and prepare an option for trading, indicating:
- Type of option
- Expiration dates
- Bet amount
- Movement forecast: UP
- Click the “buy” button and wait for the results.
Money management
Trading professionals know more about money management, who, having mastered the market, begin to consciously approach obtaining a stable income. And yet, we recommend that option beginners learn and apply the principles of money management in practice from the first steps in trading. Money management is called an effective strategy for managing an account and personal finances, which is designed to solve such important issues as thoughtful work with a deposit, measures to preserve and increase funds on it.
Trade with a minimum of funds: try to spend a minimum of money on trading; bet on the option about 5% of the account amount; take part in options, the price of which is much less than the funds in the account; Choose a broker carefully and choose the one who will guarantee the best performance and profitability. By following this strategy, you will be able to easily save funds on your deposit.
Transfer a minimum of funds to a deposit: try to work with minimum amounts; it is not recommended to put all the capital on the auction, because you may still need the funds; It is better to determine for yourself a free limit that can be used in trading and not go beyond it. By following this strategy, you will be able to save your capital easily.
Trade with a minimum of assets: try to start trading with about 2-3 assets; only when you feel more confident, you can increase the number of assets, but then you will keep the whole situation in sight; Remember, the more assets you put into operation, the greater the load on the deposit and the more difficult it is to understand the state of the deposit. By following this strategy, you can easily organize efficient work and make good profits.
Trade without emotions: try to remember the mood as an important part in trading; in this case, any unnecessary emotions will interfere with concentration and make correct predictions, and this will immediately affect the result of trading; when starting trading, tune in to serious work, where you will need analytics, informed decisions; Always be aware of the risks. By following this strategy, you can easily build a conscious attitude towards trading.
Expiration
Like the concept of money management, this is one of the main foundations of trading. Expiration (from the English Expiration, “expiration, expiration”) is the expiration date of the option, when market participants find out the results of their forecasts, and understand whether funds will come to their deposit. Expiration affects the performance and profit of your trades. In order for your options trading to bring you a stable income, consciously work with expiration.
Types of options:
- Ultra-short options (express) – 60 seconds – 5 minutes.
- Short-term options – 15 minutes – several hours
- Medium-term options – from 6 hours – a day
- Long-term options – a day – several months.
Is it possible to extend the expiration of options?
You can extend the expiration if you realize during the auction that your forecast was incorrect. Choose a broker that allows you to extend the expiration.
Expiration rules:
- If you are starting the first steps in binary options, you should use a long expiration, which will minimize the risks of express expiration.
- If you are a professional in trading and are already thinking about reducing risks, you should carefully choose a broker. Work in terminals where it is allowed to increase expiration during trading, which will prevent the loss of funds in case of an incorrect forecast of market dynamics.
- If you want to get a quick income, you should pay attention to the possibility of short-term (a minute – a few hours) expiration, which will bring earnings in just a minute. At the same time, remember that express expiration is always unpredictable and this is reminiscent of a lottery.
- If you want to get a stable income, you should pay attention to the possibilities of long-term expiration, which will bring you a decent income.
Expiration in strategies with RSI
Strategy for oversold-overbought signals
Short-term trading: not allowed, risky, reminiscent of a lottery game.
Recommended expiration: from 5 minutes to several hours; You will be able to get used to the market situation, understand the behavior of sellers and buyers, and use the indicator data correctly.
Long-term expiration: also allowed; It will help to better understand the dynamics of prices, study the influence of other factors on the market, and if you make the right decision, it will help you get a good income.
Strategy when crossing the center line
Short-term trading: allowed; You need to be careful when predicting the behavior of assets.
Recommended expiration: from 30 minutes to several hours; You will analyze market opportunities, study the data of indicators.
Long-term expiration: also allowed; You use the full range of your knowledge to ensure that the forecast is correct.
Strategy for divergence and convergence
Short-term trading: allowed; Be careful when studying the signals, refer to the data of additional indicators.
Recommended expiration: from 5 minutes to several hours; You will be able to understand the dynamics of the trend and market sentiment, study the signals of oscillators.
Long-term expiration: also allowed; It will allow you to better prepare for decision-making: you will have time to study the signals of strategies, the external situation that affects the dynamics of the market: news, economy.
“RSI + EMA” strategy
This strategy will allow you to get accurate entries into the market. You will need indicators: exponential moving average, RSI.
Short-term trading: allowed; when choosing this expiration, be careful when making a quote forecast; It is possible to make a good profit.
Recommended expiration: from 30 minutes to several hours; you will have time to analyze market opportunities, study the behavior of indicators, especially RSI, and be able to make the right decision.
Long-term expiration: also allowed; You will use the whole complex of knowledge in order for the forecast to be correct.
RSI + Bollinger Bands Strategy
A profitable strategy will allow you to get effective signals from two indicators (Bollinger Bands and RSI are used), and, which is also important, reduce the number of false signals. In this case, the RSI will signal overbought-oversold, and the Bollinger Bands will allow you to make predictions of sharp changes in the trend line.
Buy signal: RSI level 30 crossover from bottom to top (exit from oversold) and expansion of the Bollinger Bands. Sell signal: RSI level 70 crossover from top to bottom (exit from overbought) and expansion of the Bollinger Bands.
Short-term trading: not allowed, has an increased riskiness, resembles a lottery game.
Recommended expiration: from 5 minutes to several hours; You will study the behavior of both indicators, get used to the market situation, and use the indicator data correctly.
Long-term expiration: also allowed; You will be able to better understand the dynamics of prices and strategy indicators, study the impact of other factors on the market.
Short-term strategy “RSI + MACD + MA + Stochastic“
A short-term strategy that allows you to follow the trend and make profitable predictions. The strategy uses RSI, MACD, moving MA (WMA(5) and SMA(10), as well as Stochastic.
Buy signal: WMA(5) crosses the SMA(10) bottom-up, Stochastic gives an upward signal, the RSI line is greater than 50, the MACD is greater than 0, the average MACDs cross upwards. Sell signal: WMA(5) crosses the SMA(10) from top to bottom, Stochastic gives a signal down, RSI is less than 50, MACD is less than 0, average MACDs cross downwards.
Recommended expiration: from 5 minutes; the strategy allows you to get high-quality signals; It is possible to make a good profit if the forecast is correct.
Long-term expiration: not recommended; indicators in this case are focused on minimum expiration; Otherwise, it will be more difficult to monitor the quality of the signals.
In order to study in practice the possibilities and profitability of a particular expiration, we recommend using the platform of a reliable broker Finmax by going to the finmaxbo.com website. One of the advantages of the platform is that you have access to different expiration to choose from, from 30 seconds to six months.
Downloads
MetaTrader 4 (MT4) platform – download.
RSI Oscillator for MT4 platform – download.
Tagged with: Binary Options Indicator • RSI