Volumes indicator
Description
We continue to publish detailed reviews of binary options oscillators on the INVESTMAGNATES.COM portal. Each trader begins his first steps in options, studying theoretical material about technical indicators, profitable strategies and other tools. To make your trading education productive, we collect as much useful information as possible, which you can always use and get the most out of options trading. Today we will talk about the popular Volume indicator.
The Volume indicator is one of the most important analytical tools for trading, which signals the current interest in an asset (a decrease or manifestation of a large demand for an asset). With the help of an oscillator, it is convenient to analyze the impact of trading volumes on price movement. Volume is an indicator of trading activity in the market at the moment, it signals to the trader about an increase or decrease in the volume of buying or selling: the larger the volume, the more active the market, the smaller, the less, on the contrary, the market is less interested in trading the asset. The volume confirms the trend, the more active the dynamics of the market, the easier it is to understand its further movement. You can also read an overview of the On Balance Volume indicator: https://eto-razvod.ru/forex-indicators/on-balance-volume/.
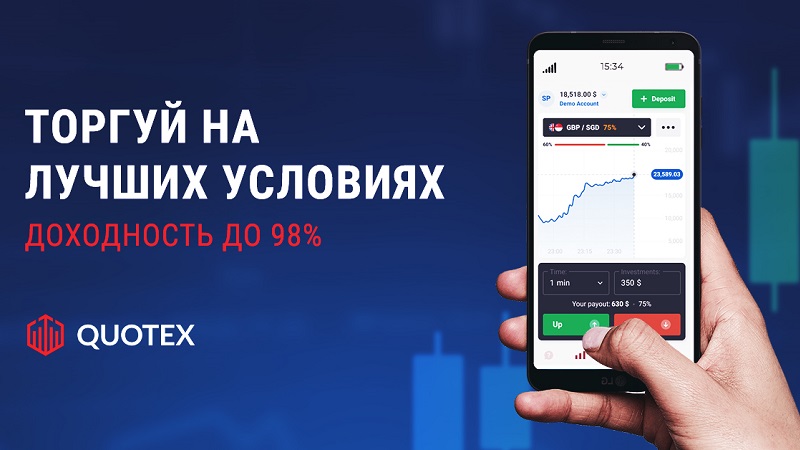
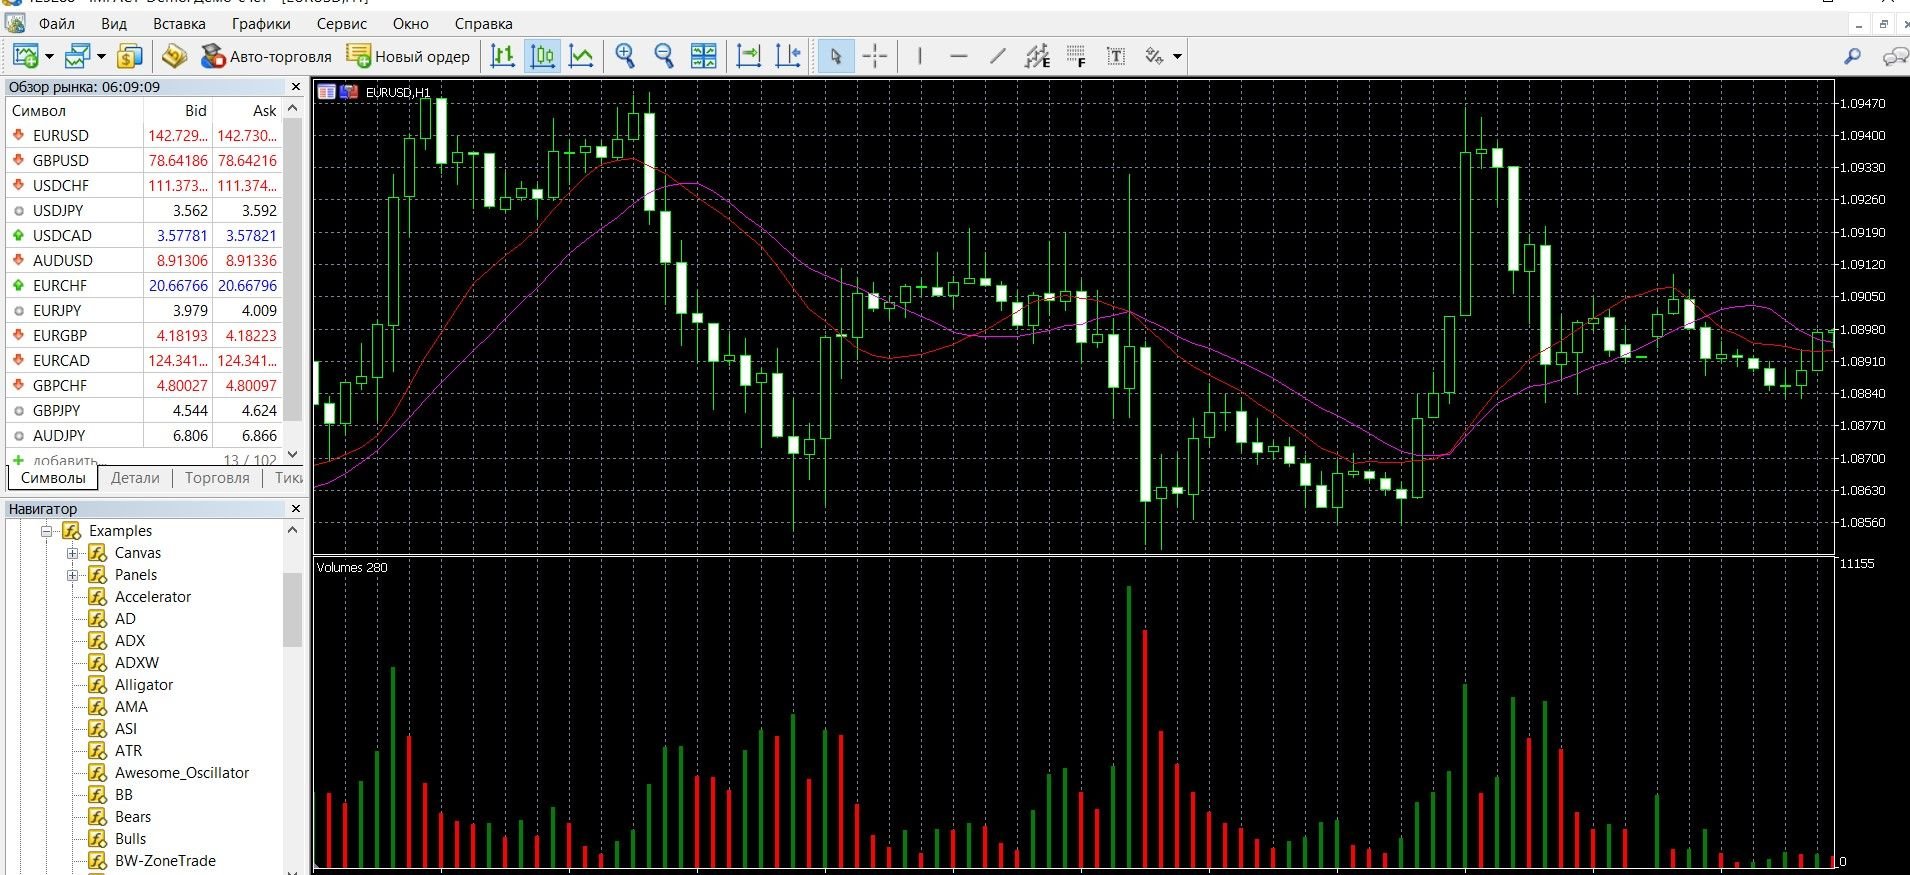
Volume indicators in options do not show real data on the money supply of an asset, they work with tick volume, i.e. This is the total number of trades opened in the market at a particular point in time. Volumes – a qualitative indicator of finding market reversal points and confirming the existing trend direction. It is especially valuable if you are trading binary options and will lead to an increase in the number of successful trades. You can see how Volumes visually looks on the MetaTrader 4 (MT4) platform in the image below. In addition, you can download the MetaTrader 4 platform and get acquainted with the oscillator in practice.
What is the principle of operation of the Volumes indicator?
The indicator is based on the comparison of materials that are obtained with the indicators recorded on the timeframe. This data helps the trader to assess the dynamics of changes in the behavior of the asset price. Volumes is widely used in the options market, it works on the principle of a simple rule known to all traders: volume confirms the trend.
There are 2 types of Volumes on the market:
- Real – indicates how much money traders are currently in the market.
- Tick – indicates calculations not of the amount of money, but of open orders.
Stock markets work with real volumes, it is impossible to calculate this data in binary options, because Volumes uses a tick construction algorithm. On the price chart, it is displayed in a separate window, but in different instruments it can be displayed in different ways: in the form of a curved line or in the form of volume columns of different colors. A red bar indicates a decrease in the volume of market transactions, a green one indicates an increase in the volume of positions. Based on the indicator, the following conclusions are drawn:
- if the volume of the asset increases, this is a high probability of either strengthening the trend or its subsequent reversal;
- if the volume of the asset decreases, it is the probability of either a flat or a change in the direction of the trend;
- if you observe a peak in volumes, then this is the probability of a change in the direction of the trend;
- If the decrease in volume occurs gradually, this is the probability of a signal for a sharp price change.
Volumes works with stocks for which the exact volume of purchases is known. It is not lagging behind with signals and it is easy and simple to work with it. In options, it is not used alone, it is recommended to combine it with other indicators (for example, MA or Fibonacci levels).
Volumes indicator signals :
Volume levels
Volume levels allow you to see the stages of decay and activity, which are confirmed by the lines of the main price chart. With a large falling candle and the upper maximum of Volumes, open an upward position:
With a large growing candle and a high of the indicator, open a deal for a fall:
Large volume and work with it
A very important signal if an abnormally high column is observed on the chart:
This means that suddenly everyone has a desire to trade, you need to open up for an increase. You need to be careful with such manifestations. This behavior may be caused by one of the following reasons:
- The formation of a trend has begun, most likely the price will continue to grow. A more common situation. It is necessary to open a position when forming a line, when you see that the volumes are growing:
- The surge could have been caused by both natural and global factors. In this case, there is no impact on the market. It is better to remain neutral here, because the behavior of Volumes and the price chart indicator diverge.
- Burst agony, when market participants squeeze the last juices out of the movement in order to then trade in the other direction. A good signal, because. A surge after a prolonged trend is a confirmation of the probability of a reversal.
Breakdown of the midline
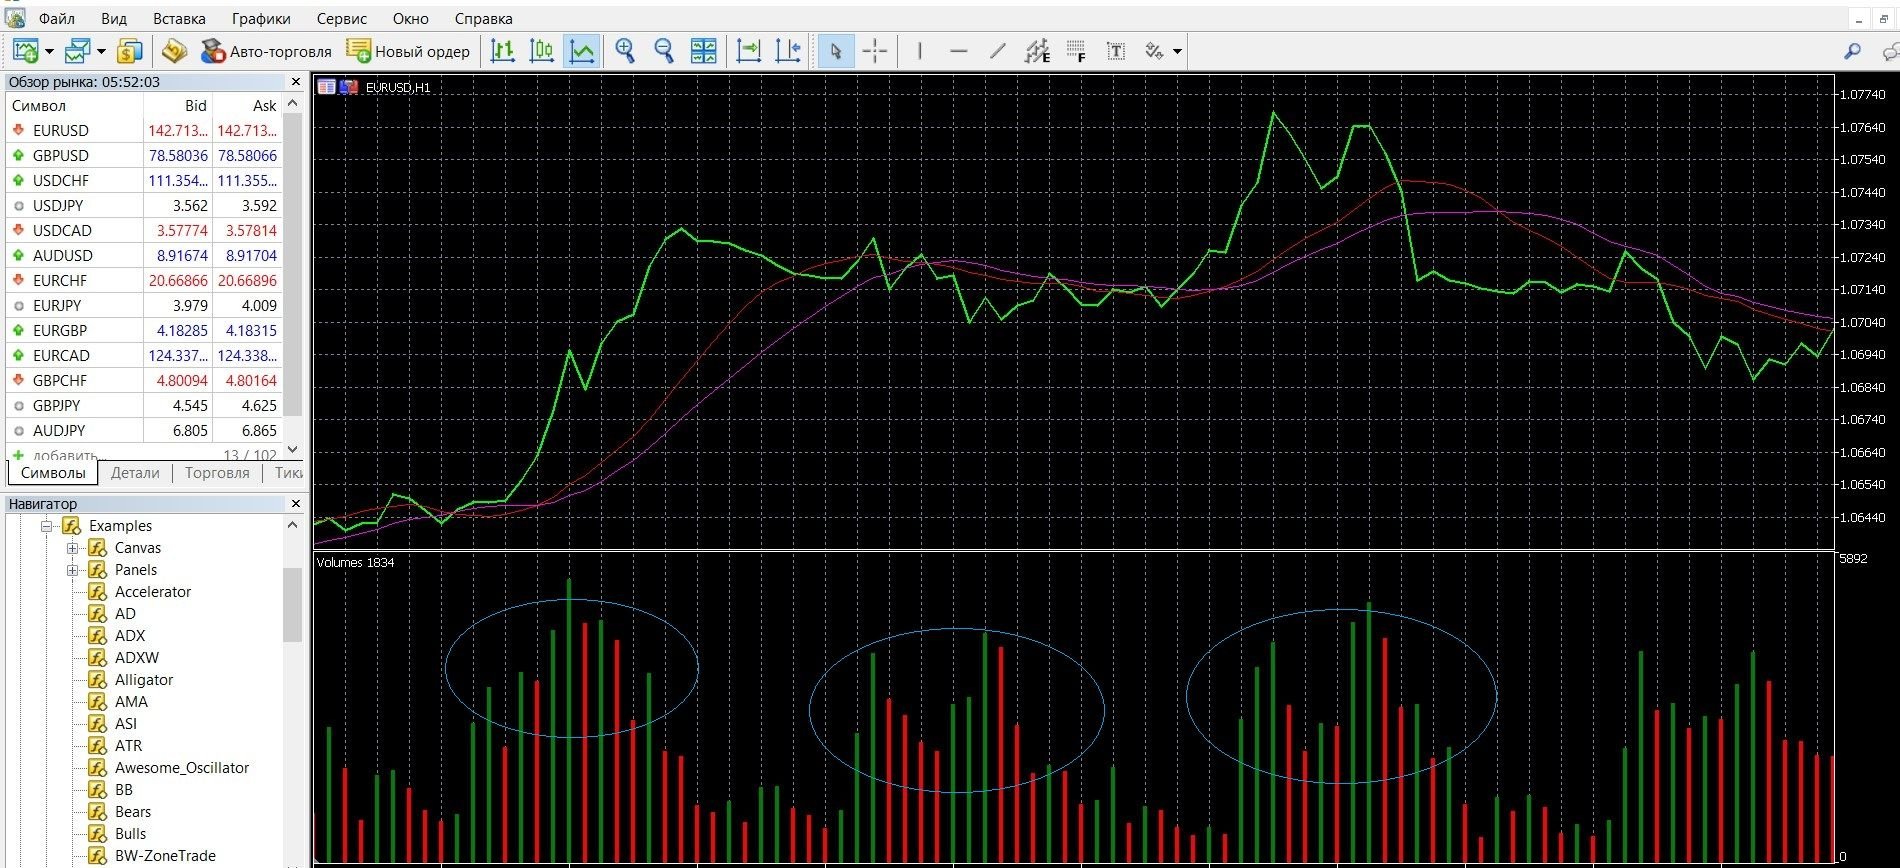
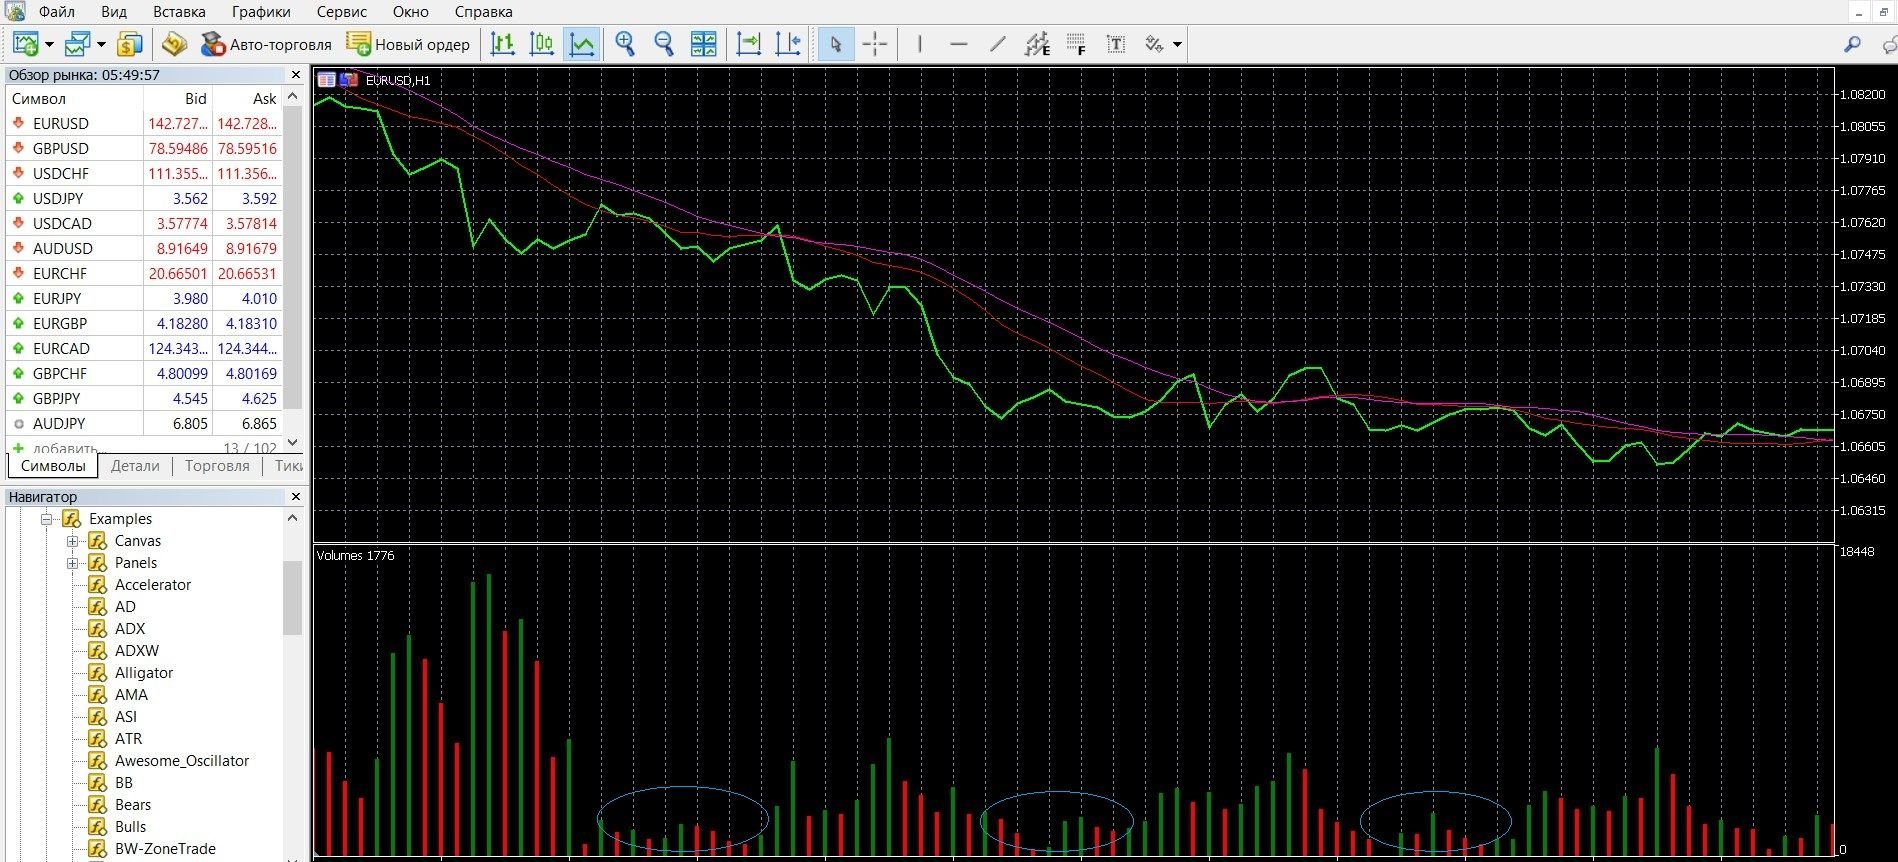
The average Volumes line is calculated by default with a period of 20, this line acts as a classic moving average, on which you can open deals. When 5-6 candles in a row are formed, this is a sure sign of a “calm” market, in this case there is a potential for a surge:
An unambiguous breakout, after which a trade is opened: the green bar indicates an increase in the trend, and the red column indicates a decrease:
Do I need to install Volumes on my platform?
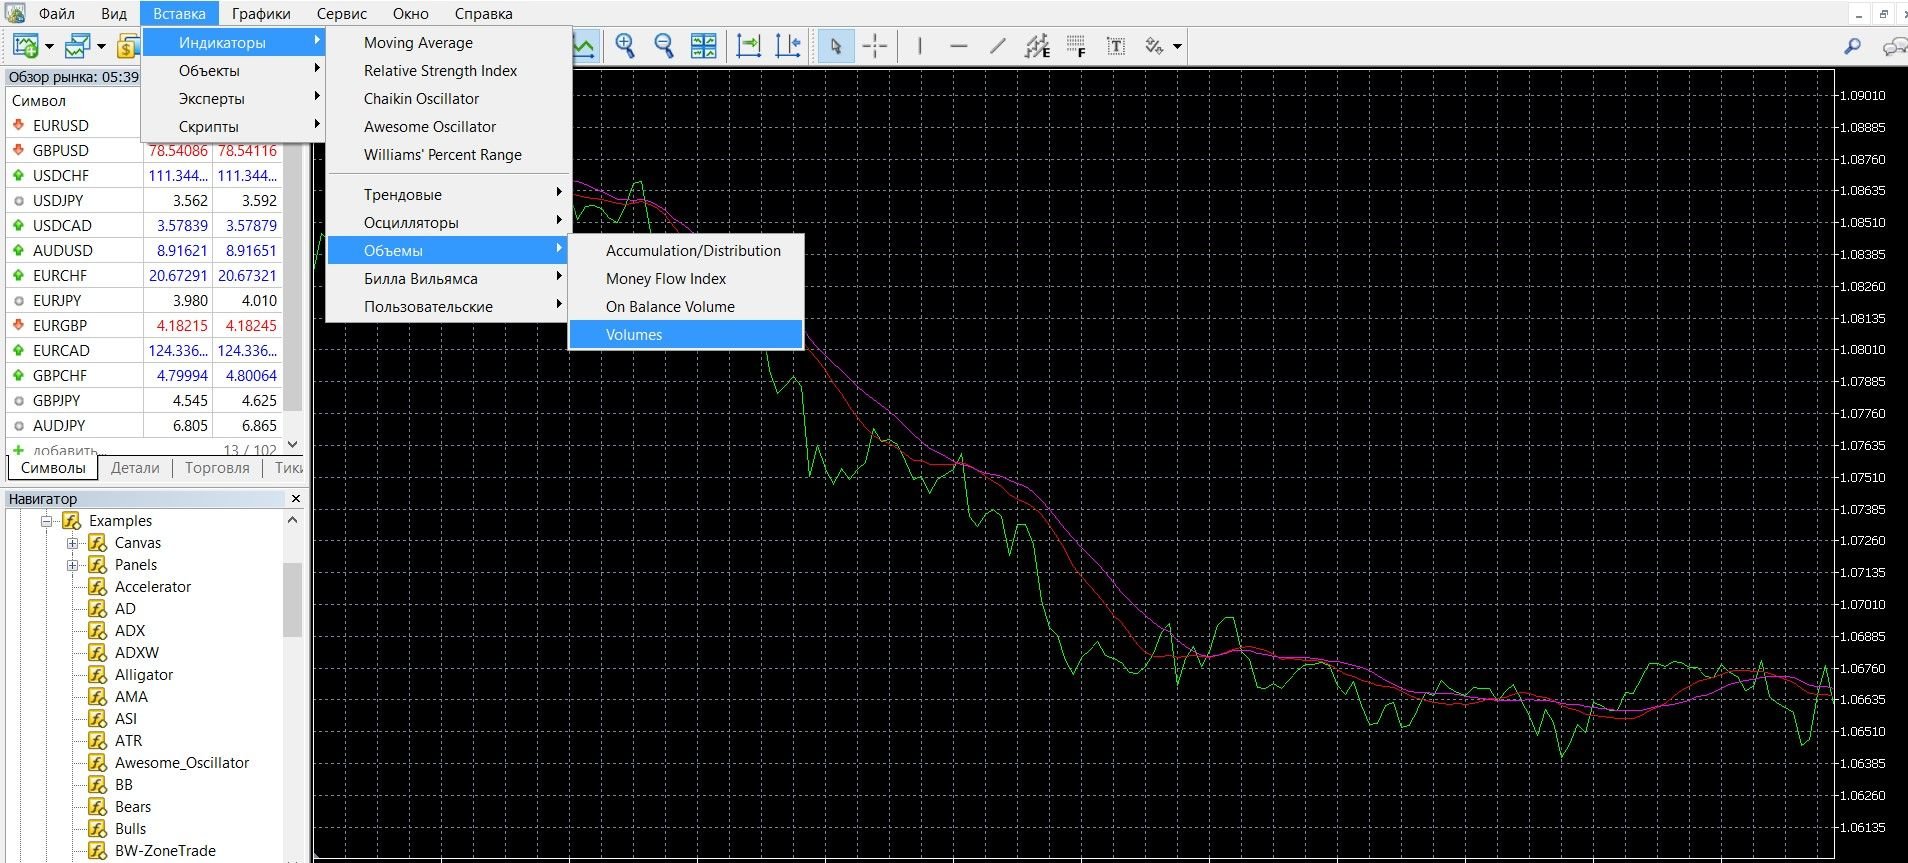
The Volume indicator is considered a classic tool for technical analysis of the market situation, it is integrated into almost all modern trading terminals, and it is also available in MetaTrader 4. To add an oscillator to the price chart, take the following steps:
- Click on the “Insert” tab in the top menu of the platform.
- Select the tab “Indicators” – “Volume”.
- In the drop-down menu that opens, select “Volumes”. The indicator is added to the chart, you can work.
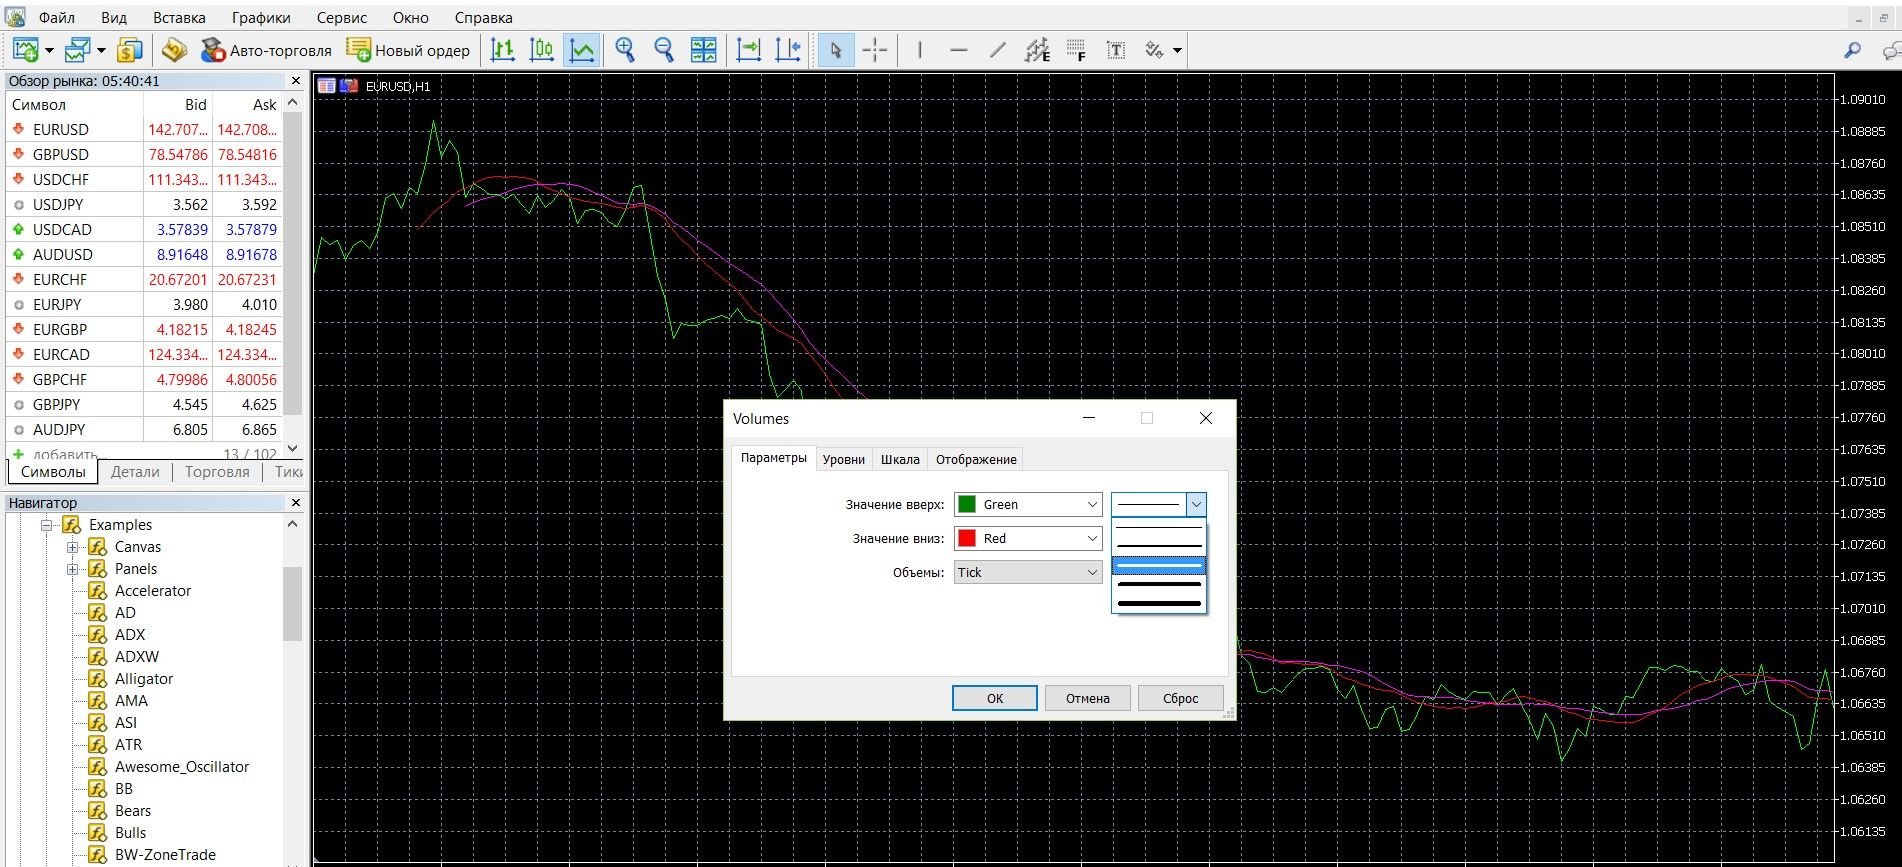
The volume is an indicator in the form of a histogram located under the chart. When you add it to the price chart, you can change the color and gamma settings for the display bars, you can also choose a convenient thickness for the bars. As a standard, the red pillar indicates a market decrease in volumes, the green one indicates an increase in volumes; There is also a blue zone that reflects the average value of volumes for the specified period. The height of the bars depends on the total number of transactions that were concluded in a certain period of time.
If your platform doesn’t have an indicator, download it here.
Application of the indicator for binary options
The Volume Indicator is a simple and “classic” example of a tool that shows the probability and direction of future price dynamics. It allows you to work more conveniently with the analysis of the impact of trading volumes on the price movement in a certain direction. The indicator is necessary, first of all, in order to determine the state of activity of market participants in the time period. When working with this indicator, we are talking about tick volumes – that is, such volumes that are similar to voting. The main advantage of the Volume indicator is the ability to see the power of the market dynamics of a particular group of participants: with an uptrend, there is an increase in the volume of purchasing assets; With a downward one, on the contrary, there is an increase in sellers, which reduces the price of the asset.
It is worth remembering that this oscillator does not display information about whether the asset will rise or fall in price. But it will help determine highs, pivot points, stages of attenuation and activity in the market, whether a certain trend is confirmed by specific trading volumes. Using this information, you can develop a successful strategy and close a high percentage of your trades in plus. Volumes also shows the highs of market dynamics points, allows you to see their dependence on volumes, and shows the interest of participants in a certain trading instrument. This useful technical indicator is considered an excellent tool for confirming market entry, if interpreted correctly, the trader can see future market reversal points as well as trend changes.
Rules for concluding transactions (screenshots)
Trading by volume levels
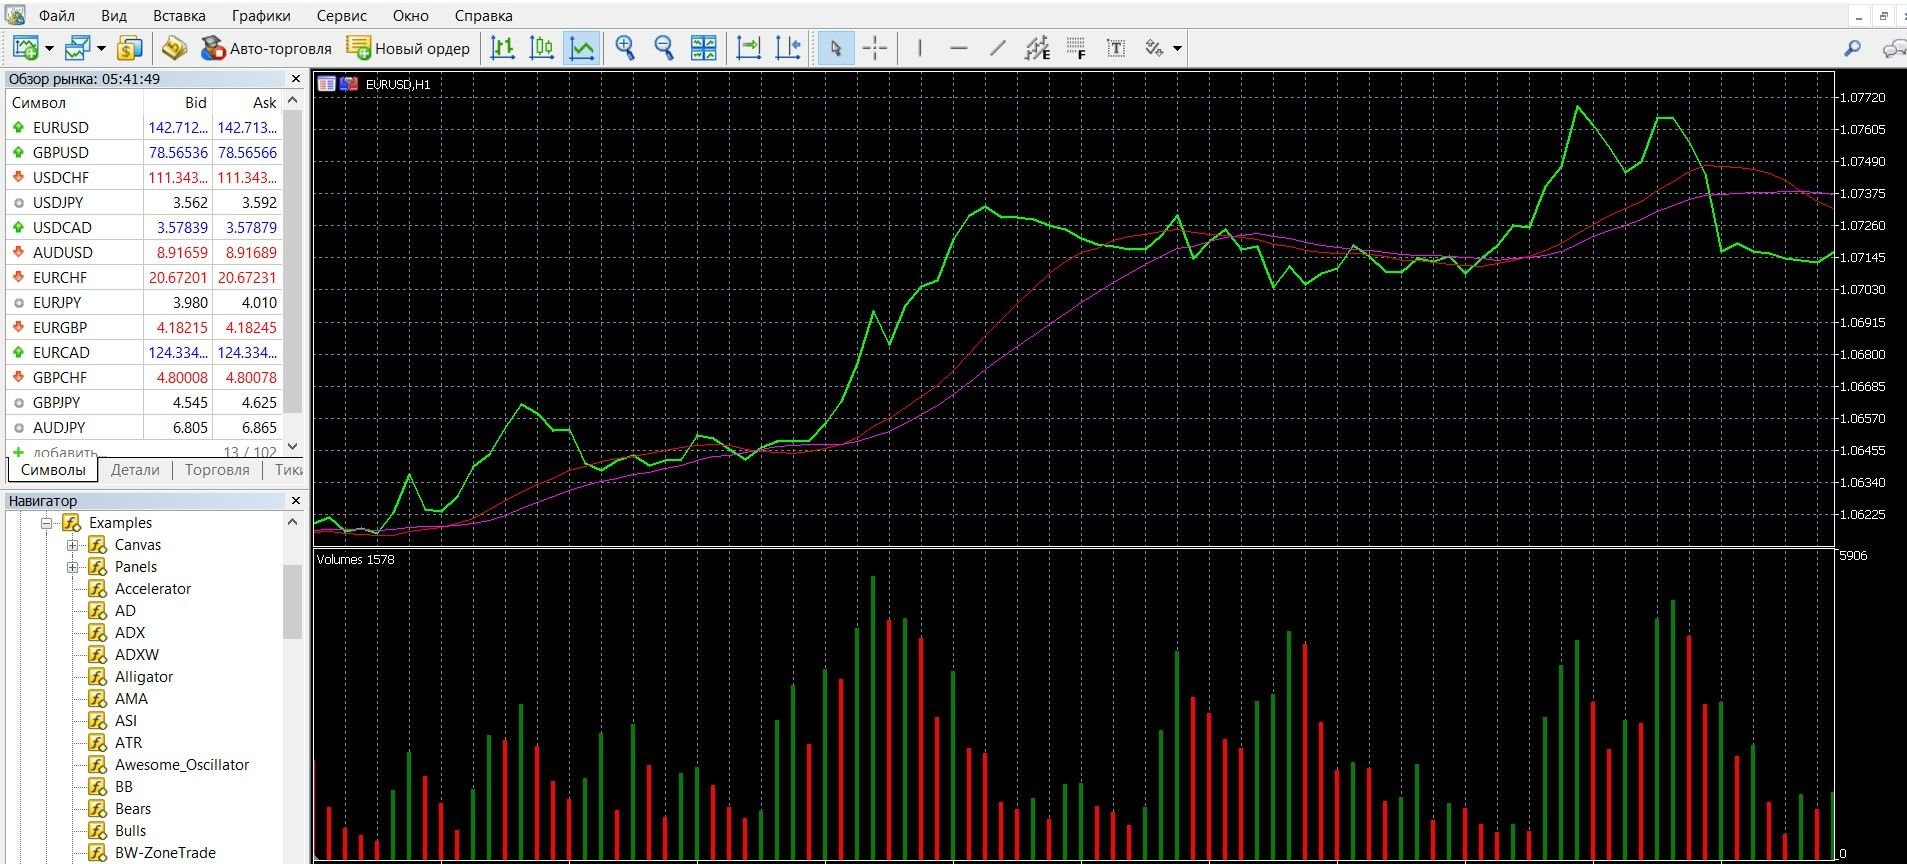
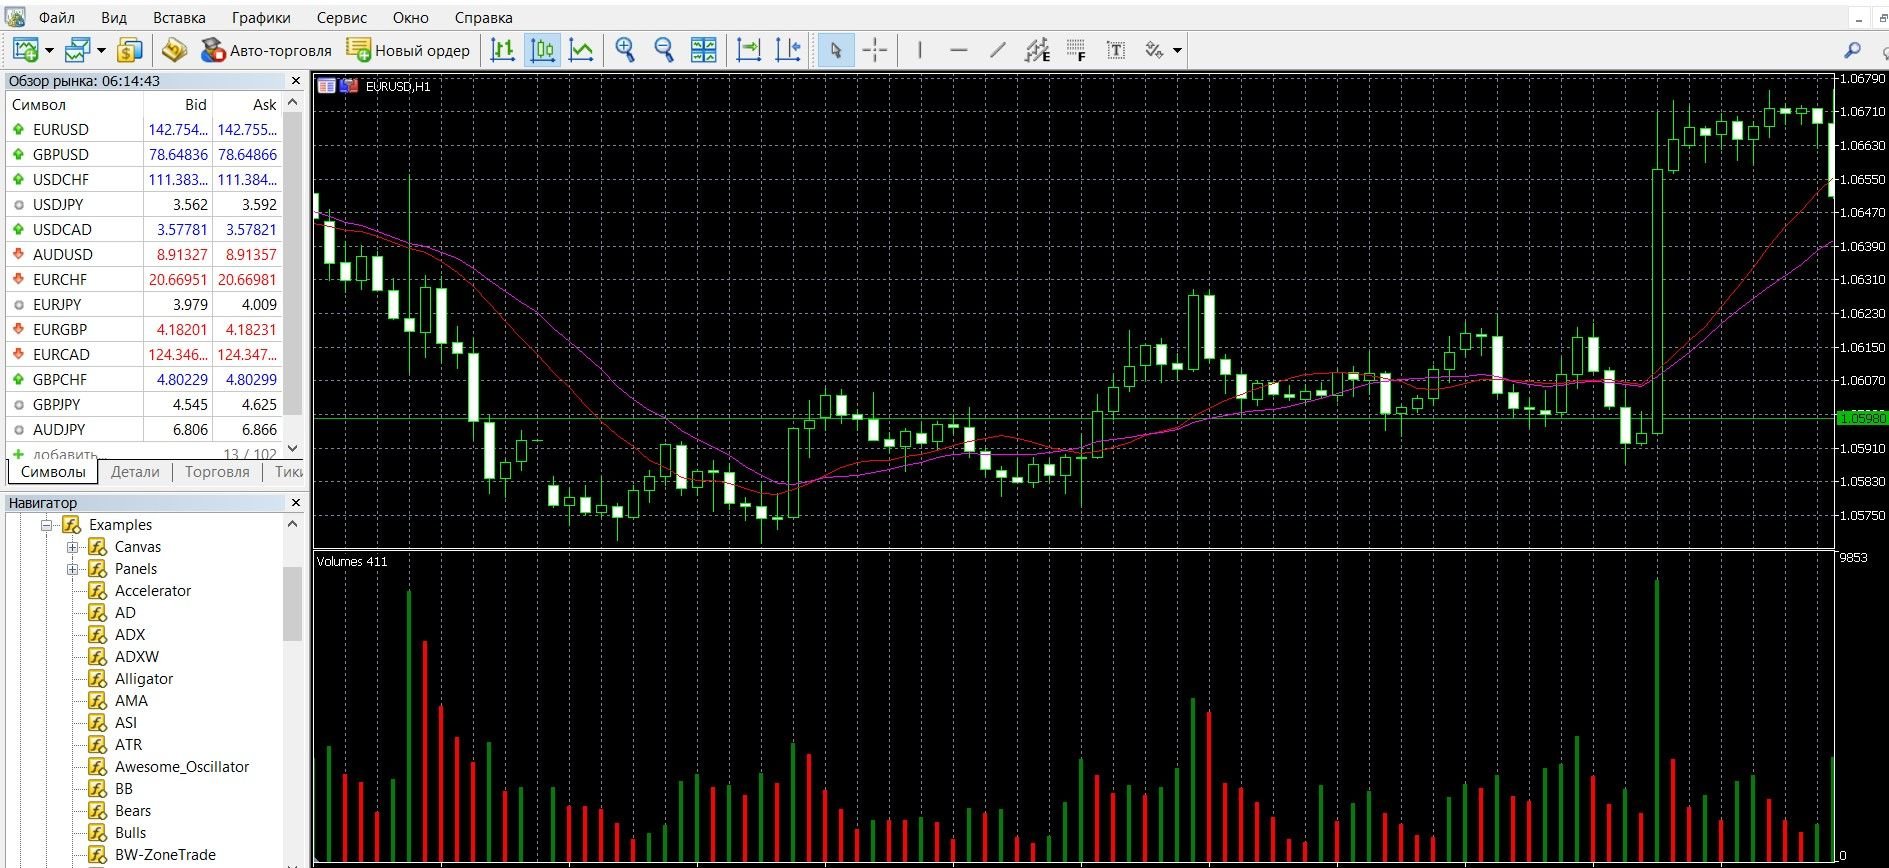
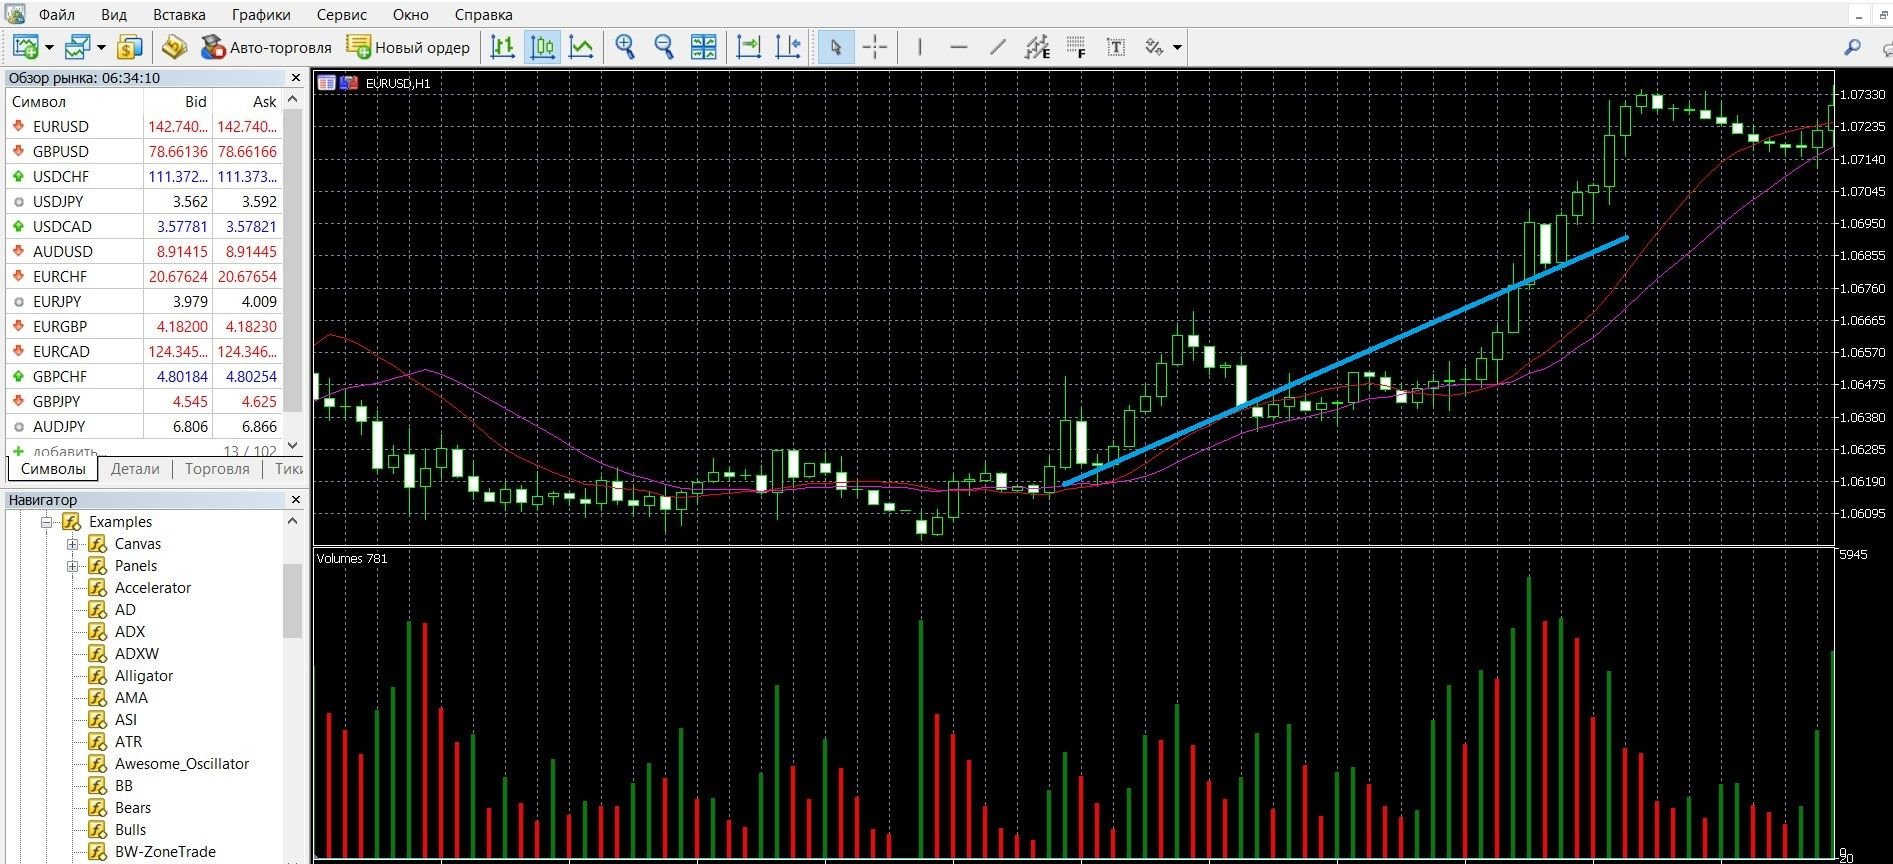
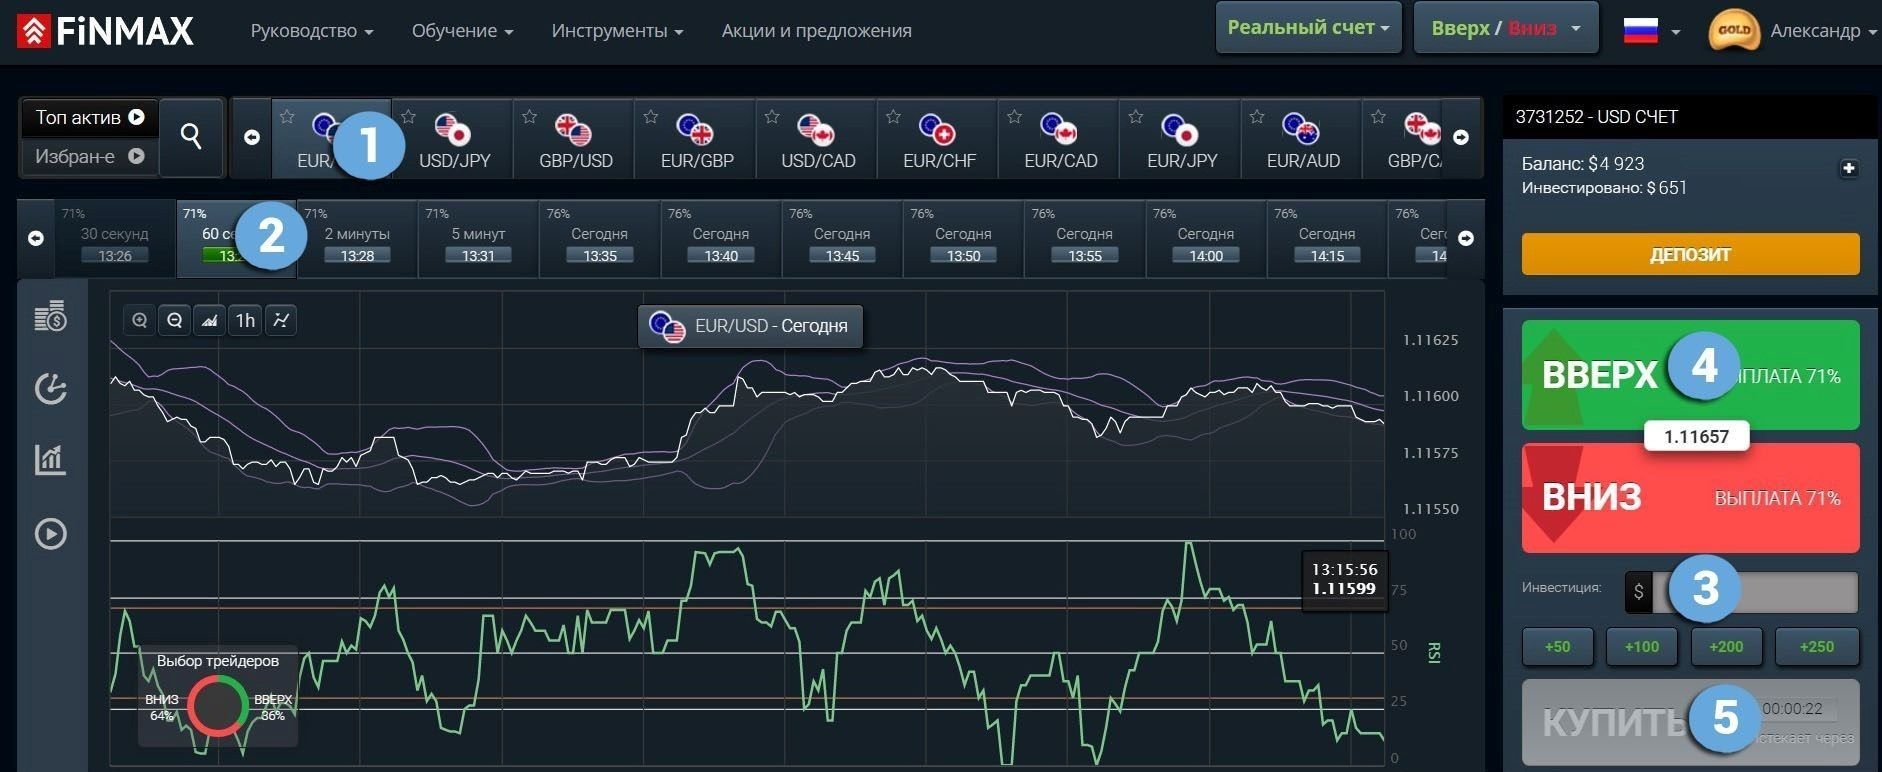
With a large falling candle and the upper extremum of Volume, open an upward position, you can buy a call option. In the image below, you can observe the upward trend of the market on the MetaTrader 4 platform:
Take advantage of the uptrend and place a CALL ( up) rate with the Finmax broker. To do this, go to the broker’s website finmaxbo.com and prepare an option for trading, indicating:
- Type of option.
- Expiration dates.
- The amount of the bet.
- Movement forecast: UP.
- Click the “buy” button and wait for the results.
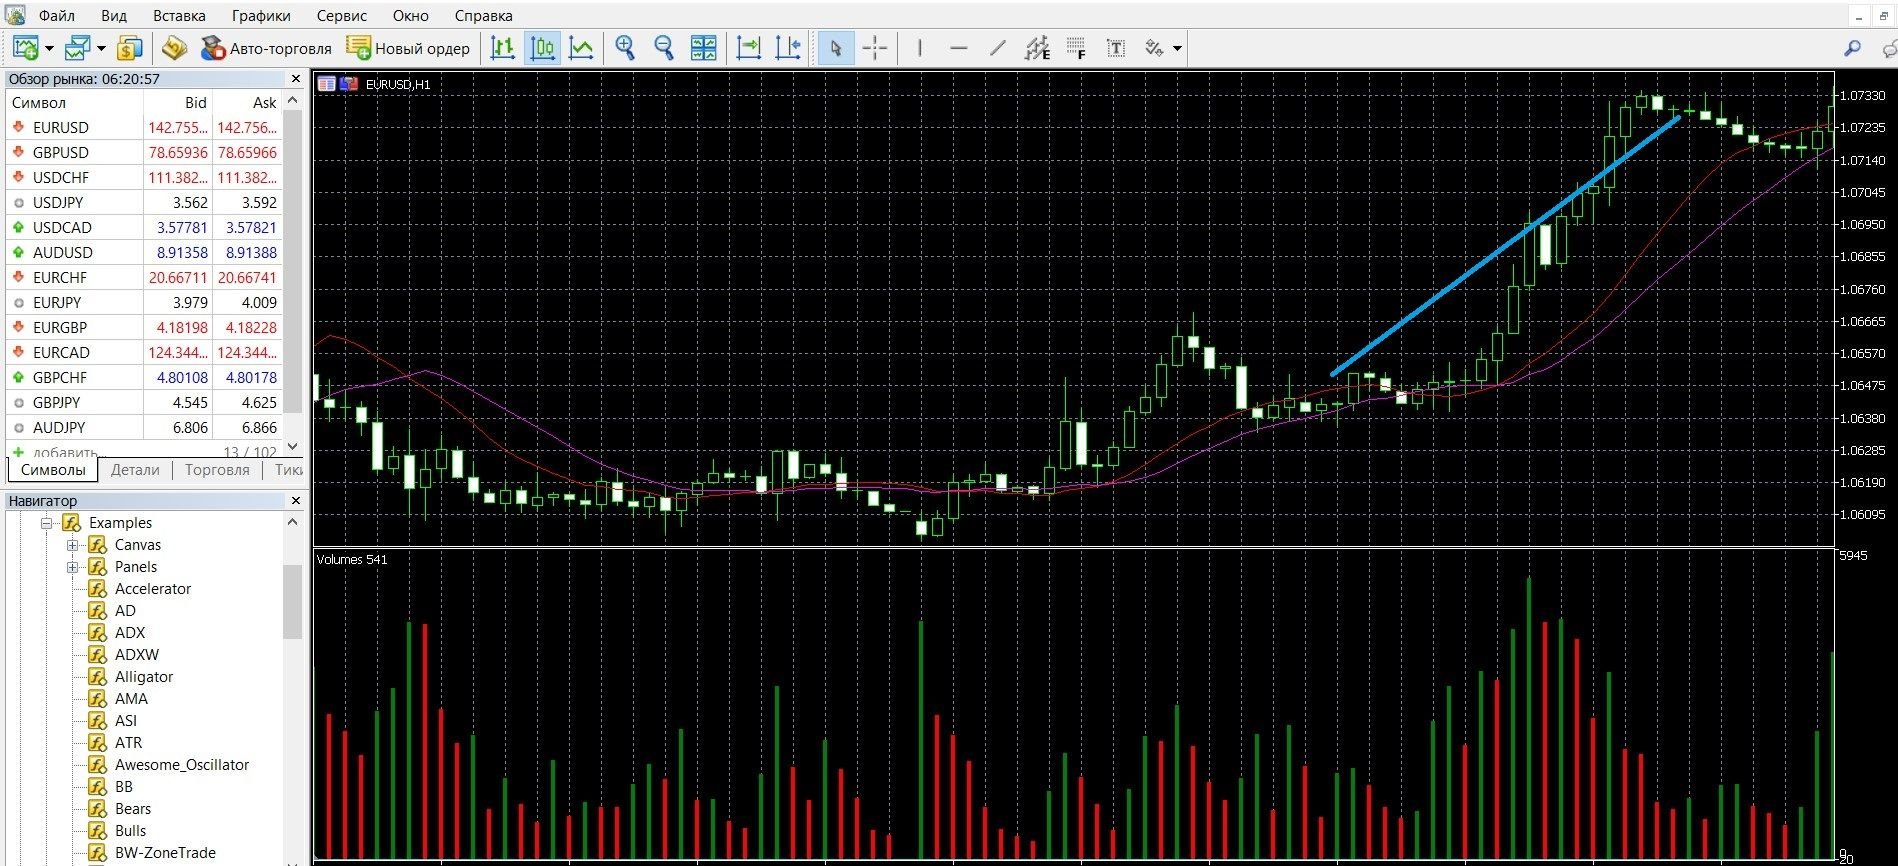
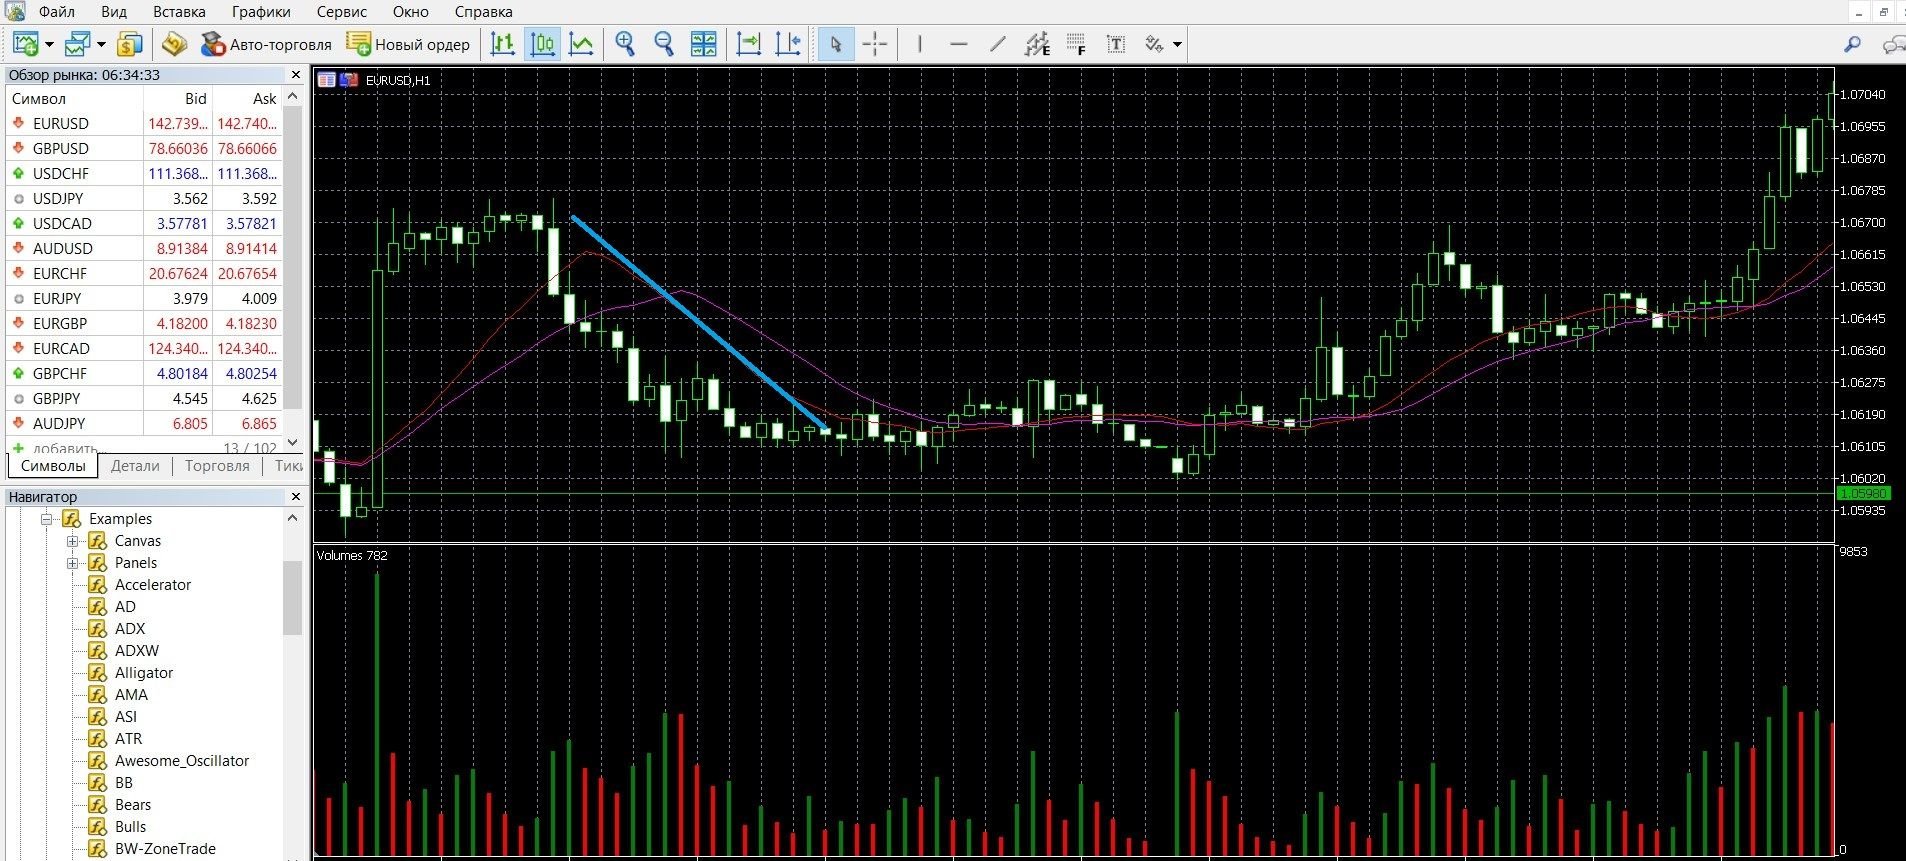
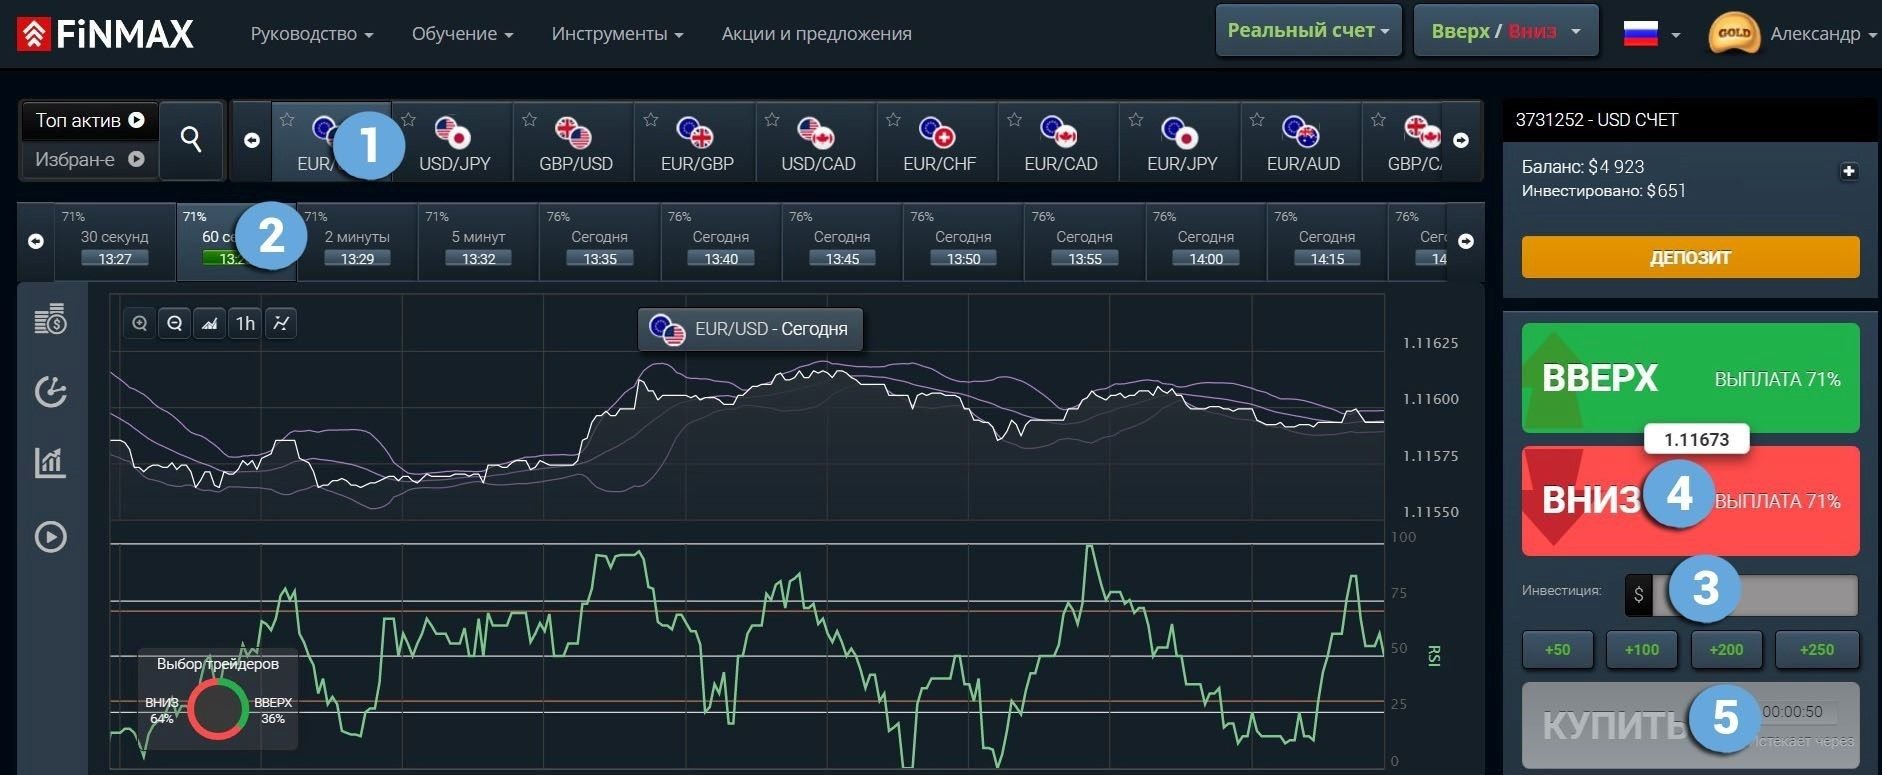
With a large growing candle and the extremum of the indicator, open a deal for a fall, you can buy a put option. In the image below, you can observe the downward trend of the market on the MetaTrader 4 platform:
Take advantage of the downtrend and place a PUT (down) rate with the Finmax broker. To do this, go to the broker’s website finmaxbo.com and prepare an option for trading, indicating:
- Type of option.
- Expiration dates.
- The amount of the bet.
- Movement forecast: DOWN.
- Click the “buy” button and wait for the results.
Trading on high volume levels
In this case, as mentioned above, it is necessary to buy a call option when forming a line, when you see that the volumes are growing. In the image below, you can observe the upward trend of the market on the MetaTrader 4 platform (buy a CALL option on the Finmax broker’s website, the instructions are listed above):
It is necessary to buy a PUT option when you see that the volumes are falling. In the image below, you can observe the downward trend of the market on the MetaTrader 4 platform (buy a PCI option on the Finmax broker’s website, the instructions are listed above):
Trading with a breakdown of the middle line
In the image below, you can observe the upward trend of the market on the MetaTrader 4 platform (buy a CALL option on the Finmax broker’s website, the instructions are listed above):
In the image below, you can observe the downward trend of the market on the MetaTrader 4 platform (buy a PCI option on the Finmax broker’s website, the instructions are listed above):
Money management
Money management, it is customary to think, is consciously more engaged in trading professionals who have already mastered the market and consciously approach to obtaining a stable income. But if you are just starting out with options, this does not mean that it is too early for you to think about money management, on the contrary, the sooner you know about it, the better for you and your results. So, money management is an effective well-thought-out strategy for managing your account and personal finances, which solves issues such as the correct work with the deposit, how to save and increase funds on it.
Trade with a minimum of funds: learn to spend a minimum of money on trading; it is worth betting on an option no more than 5% of the account amount; participate in options, the price of which is less than the amount of funds in the account; Find a reliable broker that guarantees the best performance and profitability. Follow this strategy and you can easily save your funds on your deposit.
Transfer a minimum of funds to a deposit: learn to work with a minimum amount on your account; you should not put the entire deposit on trading, because you will need the funds to recoup; Start working with a deposit by allocating a free limit from the amount that you can implement in trading and do not go beyond it. Follow this strategy and you will easily save capital.
Trade with a minimum of assets: learn to gradually complicate your work in options; It is worth starting trading with 2-3 assets, when you feel more confident, increase the number of assets. The advantage of this approach is that you will already be able to keep the whole situation under control, because the more assets you put into operation, the greater the load on your account and the more difficult it is to monitor its condition. Follow this strategy, and you can easily organize effective work from the first steps in trading.
Trade without emotions: learn to properly tune in to serious work. It is worth remembering that the mood in this case decides a lot, including the success of trading. Excessive emotions make it difficult to concentrate and make correct predictions. Starting the next auction, tune in to serious work, where analytics and balanced decisions are needed. Follow this strategy, and you will be able to build a conscious attitude to trading, which will bring a good income.
Expiration
Like money management, this is one of the basic concepts of trading. Expiration is the moment when the option expires and bidders find out how correct their predictions were, whether their funds on the deposit will be replenished. Expiration is what affects the performance of your trades. If you want your trading to bring you a stable profit, be conscious about expiration.
Types of options:
- Ultra-short options (express) – 60 seconds – 5 minutes.
- Short-term options – 15 minutes – several hours.
- Medium-term options – from 6 hours – a day.
- Long-term options – a day – several months.
Is it possible to extend the expiration of options?
You can extend the expiration if you suddenly realize during trading that you have chosen the wrong forecast. Not every broker allows you to extend the expiration, remember this.
Expiration rules:
- If you are new to binary options, you should first use a long expiration, which minimizes the risks of quick expiration.
- If you are a trading professional with good trading experience, you should think about reducing risks and carefully choose a broker. Choose brokers that allow an increase in expiration during trading, which will prevent the loss of funds in case of an incorrect forecast.
- If you want to get a quick income, you should choose a short-term (a minute – a few hours) expiration, which can give you earnings in just a minute. Do not forget, express expiration is always unpredictable and this is reminiscent of a lottery.
- If you want to get a stable income, you should choose a long-term expiration that can bring you a decent income.
Expiration in Volumes Strategies
Strategy for trading by volume levels
- Short-term trading: allowed; you can get a good income if you predict correctly; Be careful, expiration is characterized by a high degree of risk.
- Recommended expiration: from 30 minutes to several hours; You can better study the market situation, use technical analysis and make the right decision.
- Long-term expiration: also allowed; You can apply the full range of your knowledge in order to make a correct forecast and get a good income.
Strategy for trading on large volume levels
- Short-term trading: allowed; will bring a good income; Be careful, the expiration of unpredictability resembles a lottery.
- Recommended expiration: from 30 minutes to several hours; You can study the dynamics of the trend and the behavior of market participants, study the signals of oscillators.
- Long-term expiration: also allowed; You can take advantage of advanced features to make the right decision (strategies, oscillators, external situation that affects market dynamics: news, economy).
Strategy when trading on the breakdown of the middle line
- Short-term trading: allowed, you can get a good income if you predict correctly; Be aware of the risks and unpredictability of this type of expiration.
- Recommended expiration: from 30 minutes to several hours; You can take advantage of the data of other oscillators and see high-quality signals that will bring you a good income.
- Long-term expiration: also allowed; You can get high-quality signals, confirm them with indicators, macroeconomic data.
“Market Facilitation Index (MFI) + Volume” strategy
The strategy is very simple, suitable for novice traders, and capable of issuing leading signals. You will be able to determine the moments of high-quality entry into the market and make decent money on it. You will need MFI (Market Facilitation Index) and Volume indicators. Volumes will make a price prediction; The MFI oscillator will allow you to find entry points and analyze the current market. Its growth will signal a decrease or increase in volume. Terms of the purchase transaction: MFI turns blue, growth of at least 20%; The current candle and the volume candle are red. Terms of the sale transaction: MFI changes color to blue, an increase of at least 20%; The price light and volume candle are blue.
- Short-term trading: not allowed, it is difficult to track the necessary signals, there are high risks of losing funds.
- Recommended expiration: from 15 minutes to 30 minutes; You can study the behavior of the main forces of the market, see high-quality signals and their confirmation.
- Long-term expiration: also allowed; You can get high-quality signals, confirm them with indicators and other reasons, and get a decent income.
Strategy “Parabolic SAR + Moving Average + Volumes”
An interesting strategy for finding signals to enter the market. You will need indicators Parabolic SAR, Moving Average (SMA, EMA with a period of 5), Volumes. In this strategy, Volumes is used as a confirmation signal to enter the market. The Parabolic SAR signal will be the main one for entering the market, and the histogram of the Volumes indicator breaking through the moving average will be a confirmation signal. Opening buy positions: Parabolic SAR is below the price, Volumes will break through the EMA. Opening sell positions: Parabolic is above the price, Volumes will break through the SMA.
- Short-term trading: not allowed, it is difficult to track the necessary signals, there are high risks of losing funds.
- Recommended expiration: from 4 hours to one day; You can study the behavior of the main forces of the market, see high-quality signals and their confirmation.
- Long-term expiration: also allowed; You can get high-quality signals, confirm them with indicators and other reasons, and get a decent income.
To test in practice all the possibilities and profitability of expiration, we recommend using the convenient platform of a reliable broker Finmax. To do this, you just need to go to the finmaxbo.com website. Among the advantages of the terminal: a modern platform that meets modern trading trends, the possibility of a wide choice of expiration, from 30 seconds to six months, the convenience of working on the site, advanced tools for the trader.
Downloads
Tagged with: Binary Options Indicator