
Binary options analysis, binary signals and trades are generally based on just two values: PRICE and TIME. Few traders who trade binary options have thought about what the purpose of the binary indicator is, who invented it and when, and for what purpose. Ask yourself if you remember the formula for calculating the stochastic or the Ichimoku indicator. I guess you don’t remember. Can you answer how many and which indicators repeat each other’s readings? Like, for example, using Moving Averages and MACD of the same settings.
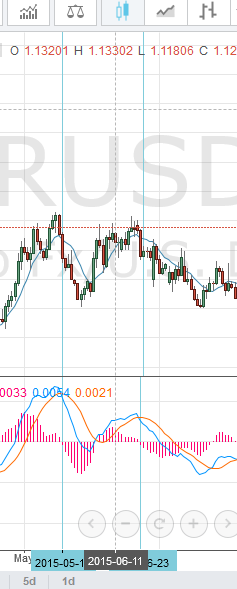
MACD and moving averages duplicate signals
In this short article, we will try to discuss the meaning and basics of indicators. This will help you choose the right tools after learning binary trading.
What is the logic of a binary indicator?
If we have an asset’s price and time, we can express it as a chart. This is a simple linear chart of the price movement of an asset. If we find price changes over a certain period of time, we can build a bar or candlestick chart. This is also the basis for the logic of constructing binary options indicators. Having measured the price differences over time, it is necessary to make these changes in the framework, and translate them into percentages. Pay attention to this is the main number of indicators.
The second is that in many indicators the average price is determined for a certain period of time. The third is if we know the distance (price difference) and time, we can find the speed, almost all volume indicators are built on this.
What conclusion can we draw from the above:
- The indicators themselves cannot predict future movement or change in the direction of price. They are created as an auxiliary tool for working on economic theories of the cyclical behavior of the price of an asset.
- If you trade on Elliot waves, or look for chart patterns, these are cycles that repeat themselves in price movements.
- Traders who trade and earn using binary strategies, at least understand and have found the pattern of price behavior, which is displayed in the behavior / indications of binary indicators.
The book “The ELLIOTT Wave Principle”