Do options charts really help in trading?
When trading binary options, traders very often use different types of analysis, which helps them identify important factors such as potential movements in the price of an asset in the future, the ideal expiration time of the option in a particular transaction. In this way, the trader can more accurately assess the situation and determine in which direction the price of the asset will move before placing the lot.
The two main types of analysis that are commonly used in binary options trading are fundamental and technical analysis. Some traders like the first, others like the second type of analysis, but as a rule, it is best to use a combined approach, which will allow you to more accurately determine the direction of movement of the price of each asset.
What is the technology according to the schedule?
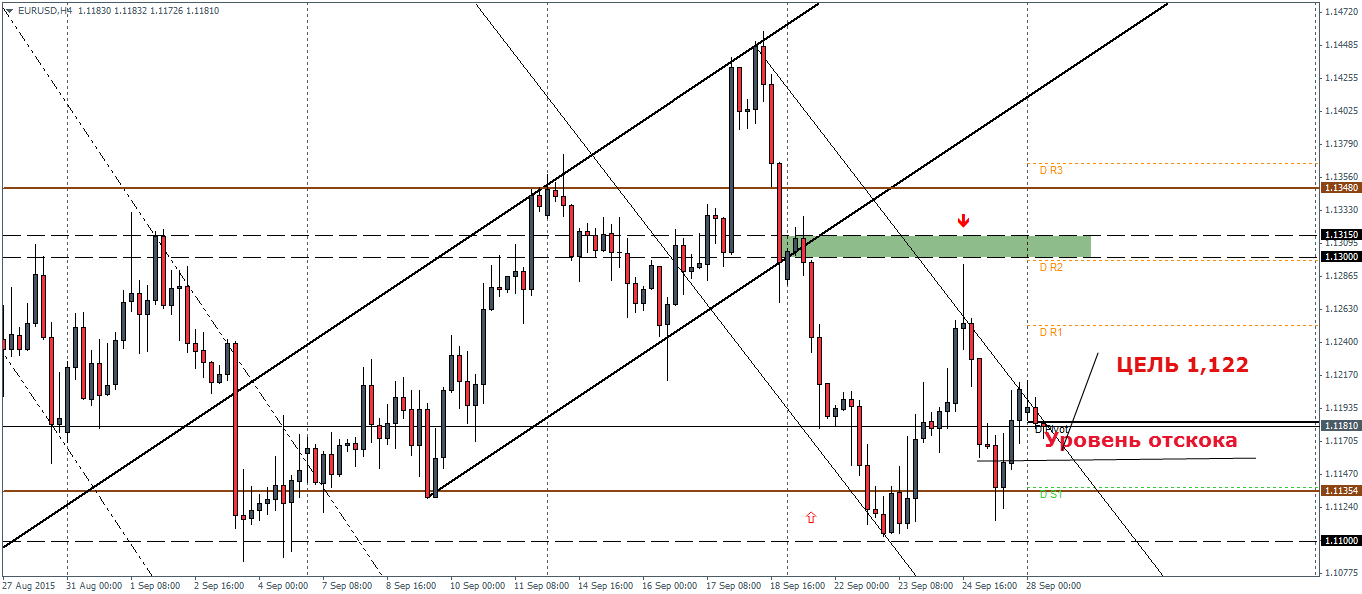
When traders use technical analysis, they use various charts and charts to study the movement of prices in the market in order to track the information. Those who use various technical schemes and charts, as a rule, believe that most of the information necessary for making a decision on trading is contained in these sources. In such cases, studying the behavior of the asset’s price will help the trader better determine future movements.
Traders can use different types of technical analysis in order to identify potential price movements of a particular asset. This allows the trader to study historical fluctuations in order to predict whether the price of an asset will move in the future. Many traders use charts as part of technical analysis, and there are already some that have gained universal recognition for their high level of reliability in indicating potential price movements. The most popular of them are used by both professionals and beginners in trading, it gives a high level of probability that the price will move in a certain direction, if there is a historical conditionality for this.
Why do schemes work?
Schemes work for two reasons:
- First, they represent a visual representation of supply and demand in any market. This affects the price and causes it to move in a certain direction, the scheme displays this movement in the form of a certain pattern, to which traders add a memorable name. Sample patterns, such as “double top” or “double fall”, for example, are relevant for displaying weaknesses in the market and thus signal a potential reverse movement or price correction. The fact that the price tries to break through the bottom or top twice, and then falls, results in a movement in the opposite direction.
- The second reason why schemes are effective is that it is kind of like a prediction that ensures its own fulfillment. The most popular schemes are known to almost all traders, who in this case trade in the same way, as a result of which the price moves in the desired direction. And while some look at it with skepticism, those who develop schemes argue that patterns indicating an imbalance in supply and demand are the basis for trading. In this way, traders simply react correctly to what the schemes tell them.
It doesn’t matter why the schemes are so effective, but what is obvious is that with their use, binary options trading can be very profitable.
» Technical analysis of financial markets
Schemes used in binary options trading
There are several types of them that are used in technical analysis. These can include studying momentum, following a trend, and meaning reverse analysis.
Momentum Study – The study of momentum, which is also known as the Average Moving Convergence or Divergence (MACD), is a measurement of the momentum of the market. This type of analysis helps the trader determine whether the momentum of an individual asset is falling or rising. The study of momentum will help to measure and compare the daily movement of means with long-term averages. And if the changes that occur with the short-term averages are greater than the changes that occur with the long-term averages, then the analysis will show that the momentum of the asset is likely to rise.
Trend Following – Trend following is a historical analysis of an asset’s price and moving averages, which helps determine whether a particular asset is following a certain trend or not. In most cases, average movements are determined minus the days that are farthest and do not affect the overall count. For example, if a trader studies a certain asset and the average movement of its price over 7 days, then the information for the 8th day will be omitted. As a rule, it is possible to determine whether an asset follows the trend or not, and whether the short-term average movements are above or below the long-term averages.
Alternation Law – Traders who use the alternation law for technical analysis will base their predictions on the direction of price movement on the assumption that the price of an asset will return to its original position – or the average position – after it has moved away from this value for a certain time. In many cases, traders will use alternating analysis to compare two similar assets.
By studying the price movement of an asset in the past, a trader can quite successfully determine the future price of such an asset. And, since many traders prefer to use fundamental analysis, the study of the potential supply and demand for an asset depending on economic and market conditions – and it is in this case that the use of technical analysis will lead to success.
Tagged with: Binary Options Chart


