Ichimoku indicator
Description
Today’s general interest in trading is easy to explain: everyone is attracted by the possibility of making money on options. You can get real money in as little as 30 seconds. And yet, most traders do not stop at express trading and go further: they study indicators, new strategies in order to make money stable. To educate market players, the INVESTMAGNATES.COM portal publishes useful materials, detailed reviews of oscillators, news and current ratings of brokers. Today we will tell you about the features of the Ichimoku tool.
The Ichimoku Kinko Hyo indicator is a highly effective tool that is able to determine the rate of growth of the price of the future period, and also signals future areas of support and resistance. Ichimoku was developed in the 30s. years of the last century by the Japanese analyst and trader Goichi Hosoda.
Translated from Japanese, the name of the indicator means: “ichimoku” – “look”, “kinko” – “equilibrium”, “hayo” – chart. Ichimoku Kinko Hyo is more used in trading currency pairs with JPY. Due to the functionality and accuracy of the signals, the tool is popular with traders, and has become the basis of many author’s profitable strategies.
The tool can be used on a candlestick chart, because This type of chart does not accurately indicate the entry and exit points. A significant advantage of Ichimoku is the high level of signal accuracy in the event of a trend or its absence.
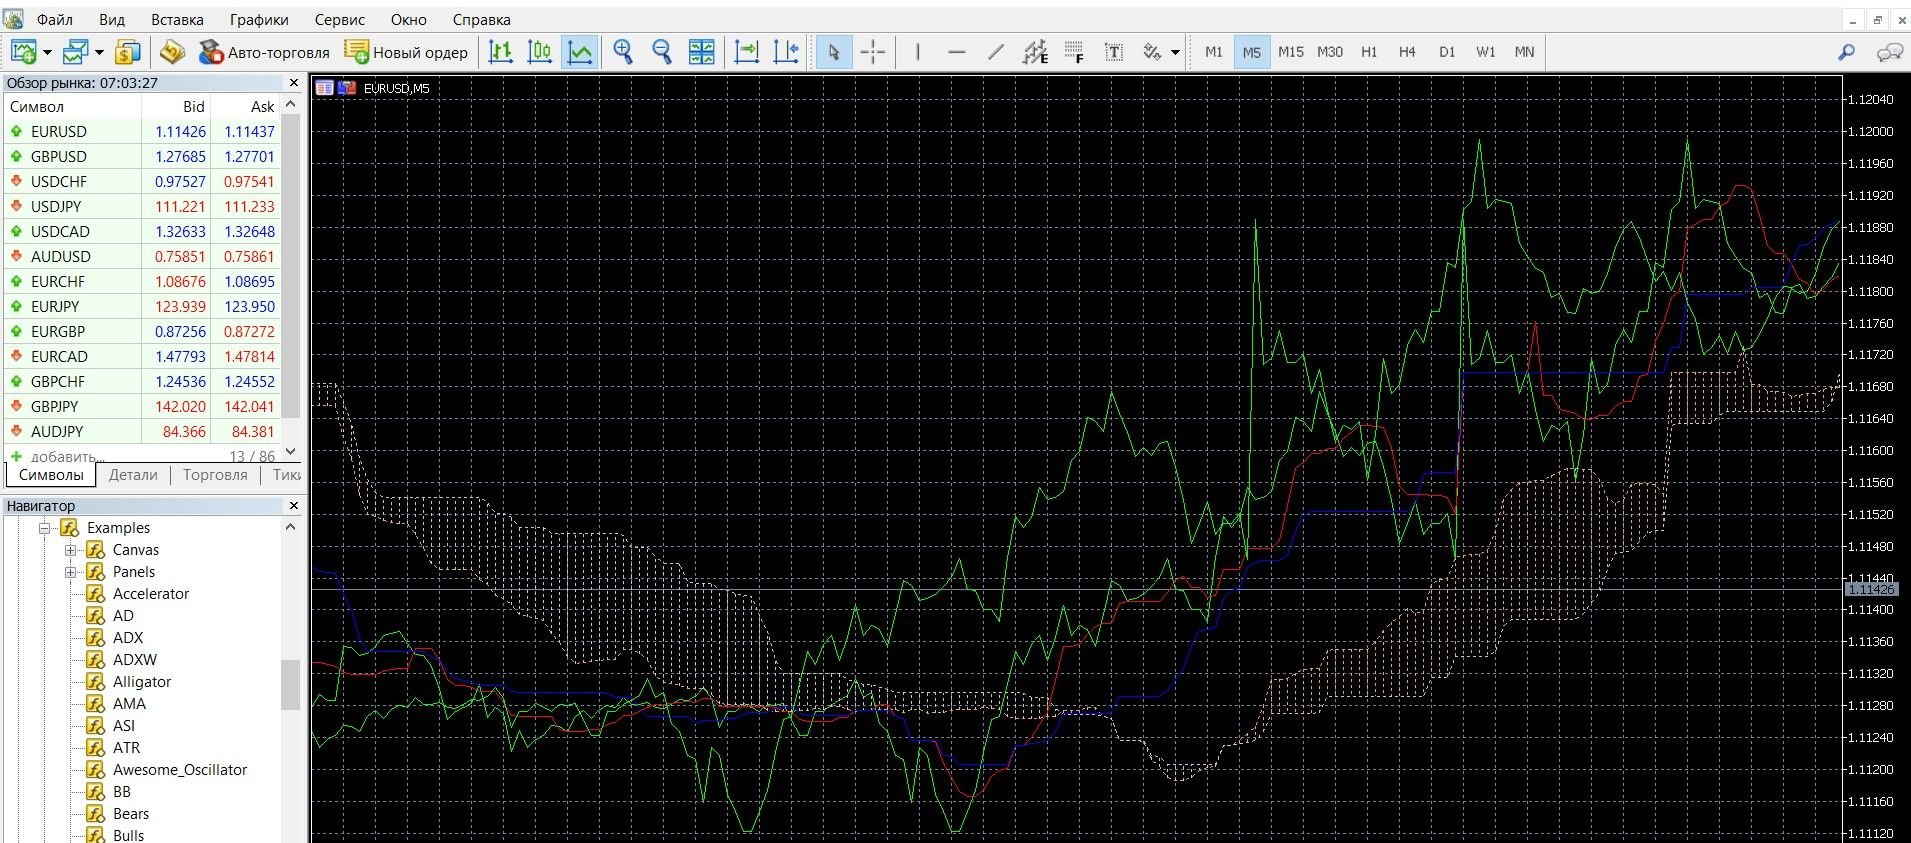
You can see how the oscillator looks visually on the MetaTrader 4 (MT4) platform in the image below. You can also download the MetaTrader 4 platform and get acquainted with this tool in practice.
Principles of operation of the Ichimoku indicator
A unique advantage of this tool is that both the support-resistance levels and the trend indicator are indicated on the same chart at the same time. It is convenient and serves as a reliable support during trading.
The purpose of Ichimoku Kinko Hayo is to identify entry and exit points. It shows itself perfectly in the trending state of the market. To understand the features of the instrument, it is important to know the features of its construction on the chart.
Ichimoku consists of the following lines:
Kinjun-sen (Kijun-sen) – blue line, is the base, main line; This is the arithmetic average of the minimum and maximum of the price over the last 26 periods. Its difference is that it demonstrates the dynamics of a long-term trend.
Tenkan-sen (Tenkan-sen) – a red line, is a “turning line”, a reversal line; This is the arithmetic mean of the minimum and maximum of the price for the last 9 periods. Its difference is that it demonstrates a “fast” trend, being short-term.
Chikou Span (Chinkou Span) – green line, is the so-called “delay line”, delay; This is the closing price of the candle, which is shifted 26 periods ago.
Senkou Span: orange lines:
- The first Senkou Span A is the average between Tenkan Sen and Kijun Sen, shifted 26 periods ahead. This is the upper limit of the cloud, the line of future support.
- the second Senkou Span B (leading line) is the average of the high and low of the price for 52 periods, shifted 26 periods ahead. This is the lower boundary of the cloud, the future resistance (support) level.
The space between these two lines is shaded, this is the “Ichimoku cloud”. Ichimoku is often referred to as the “equilibrium graph” that determines qualitative signals, and the Cloud serves as a filter for information chaos.
So, all indicator signals are based on the intersection of these lines and the price chart. Ichimoku combines several indicators on one chart, which gives you a ready-made and reliable trading system in which you do not need other tools to make a decision about a trade.
Calculation formula:
Tenkan-senTenkan-sen
Tenkan-sen = (Max (High,N) + Min (Low,N)) / 2
Max (High,N) — The highest of the maxima for a period equal to N intervals (for example, N days)
Min(Low,N) — The smallest minimum for the period equal to N intervals, N is the length of the period;
Kinjun-sen
Kijun-sen = (Max (High,M) + Min (Low,M)) / 2
M is the length of the period
Chinkou Span
Chinkou Span = Current Close shifted back by M
Hatched area (cloud) between
Senkou Span “A”
Senkou Span A = (Tenkan-sen + Kijun-sen) shifted forward by M intervals
Senkou Span “B”
Senkou Span B = (Max (High,Z) + Min (Low,Z)) / 2,shifted forward by M intervals
Z is the length of the interval
N=9, M=26 and Z=52:
9 – one and a half working weeks
26 – the number of working days per month in Japan with a six-day schedule
52 — number of weeks per year
Info taken from fintrader.pro website.
Ichimoku indicator signals:
Ichimoku signals can be divided into three groups:
- Signals that form indicator lines (intersections of the Senkou Span A and Senkou Span B lines; “Crosses”);
- Signals formed by a combination of the price chart and Ichimoku (rebound and breakout of the line);
- Signals formed by the combination of the price chart and the Chinkou Span (breakout and rebound of the Chinkou Span).
And now we will tell you more about these signals.
1 Signal group:
“Crosses” are the signals of the intersection of the Tenkan-sen and Kijun-sen lines on the chart:
- If the Tenkan-sen line is crossed by the Kijun-sen line from bottom to top, this is the so-called “Golden Cross” combination, a signal to buy a call option.
- If the Tenkan-sen line is crossed by the Kijun-sen line from top to bottom, this is a “Dead Cross” combination, a signal to buy a PUT option.
This type of signal is considered one of the most reliable, because. The indicator shows a pronounced trend movement.
Intersections of Senkou Span A and Senkou Span B cloud lines
- If Senkou Span A is located below Senkou Span B, this is a downtrend, a signal to buy a put option.
- If Senkou Span A is above the Senkou Span B line, it is an uptrend, a signal to buy a CALL option.
- If the price chart is above the cloud, it is an uptrend.
- If the price is below the cloud, there is a downtrend.
- If the price is in the cloud, the market is flat.
2 Group of signals. Signals formed by the combination of the price chart and the Ichimoku line:
- rebound from the Ichimoku Line;
- breakdown of the Ichimoku line.
Breakdown and rebound of the price from Tenkan-sen
- Tenkan-sen rebounds in the direction of the main dynamics, with a downward trend, buy a PUT option, with an upward trend, buy a CALL option.
- The Tenkan-sen breakout signal occurs at the beginning of a trend change, with a downward trend, we buy a PUT option, with an upward trend, we buy a CALL option.
Breakout and rebound of the price from Kijun-sen. Kinjun Line indicates the direction of the medium-term trend:
- If the price is above the Kijun line, the uptrend is likely to continue.
- If prices are located below Kijun-sen, there is likely to be a trend drop.
Signal of three lines. It occurs when all three indicator lines, i.e. Tenkan-sen, Kijun-sen, and cloud are built sequentially during a trend:
- If the order of the lines from top to bottom looks like this: price chart – Tenkan – Kijun – Senkou Span B, this is an upward trend in the market, a signal to buy a call option.
- If the opposite order of the lines is implemented on the chart, this is a downward trend, a signal to buy a PUT option.
3 Group of signals. Chinkou Span Crossing:
- The crossover of the price by the Chinkou Span line from bottom to top is a signal to buy call options.
- If the opposite happens, then a signal to buy put options.
Do I need to install the Ichimoku indicator in your platform?
Ichimoku is considered a standard indicator that is included in most trading terminals, and it is also available in MetaTrader 4. To get started with it, you need to add it to the main price chart, to do this, do the following:
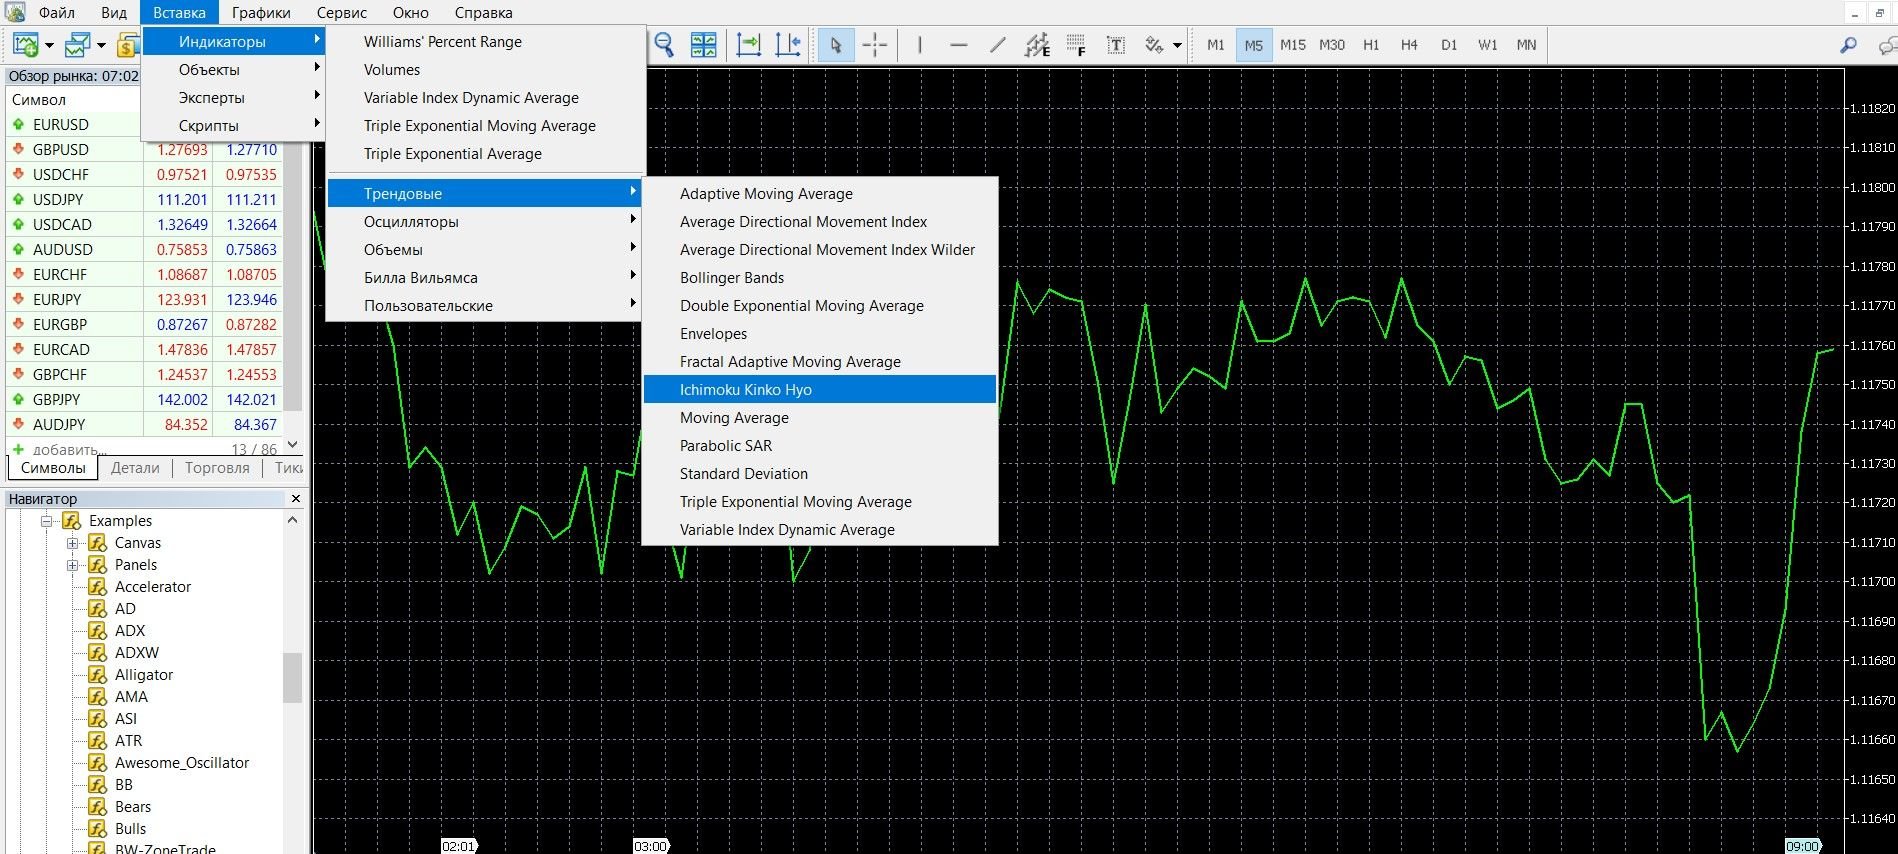
- Click the “Insert” tab in the top menu of the platform
- Select the tab “Indicators” – “Trending” – “Ichimoku Kinko Hyo”. The tool has been added to the chart, you can start working with it.
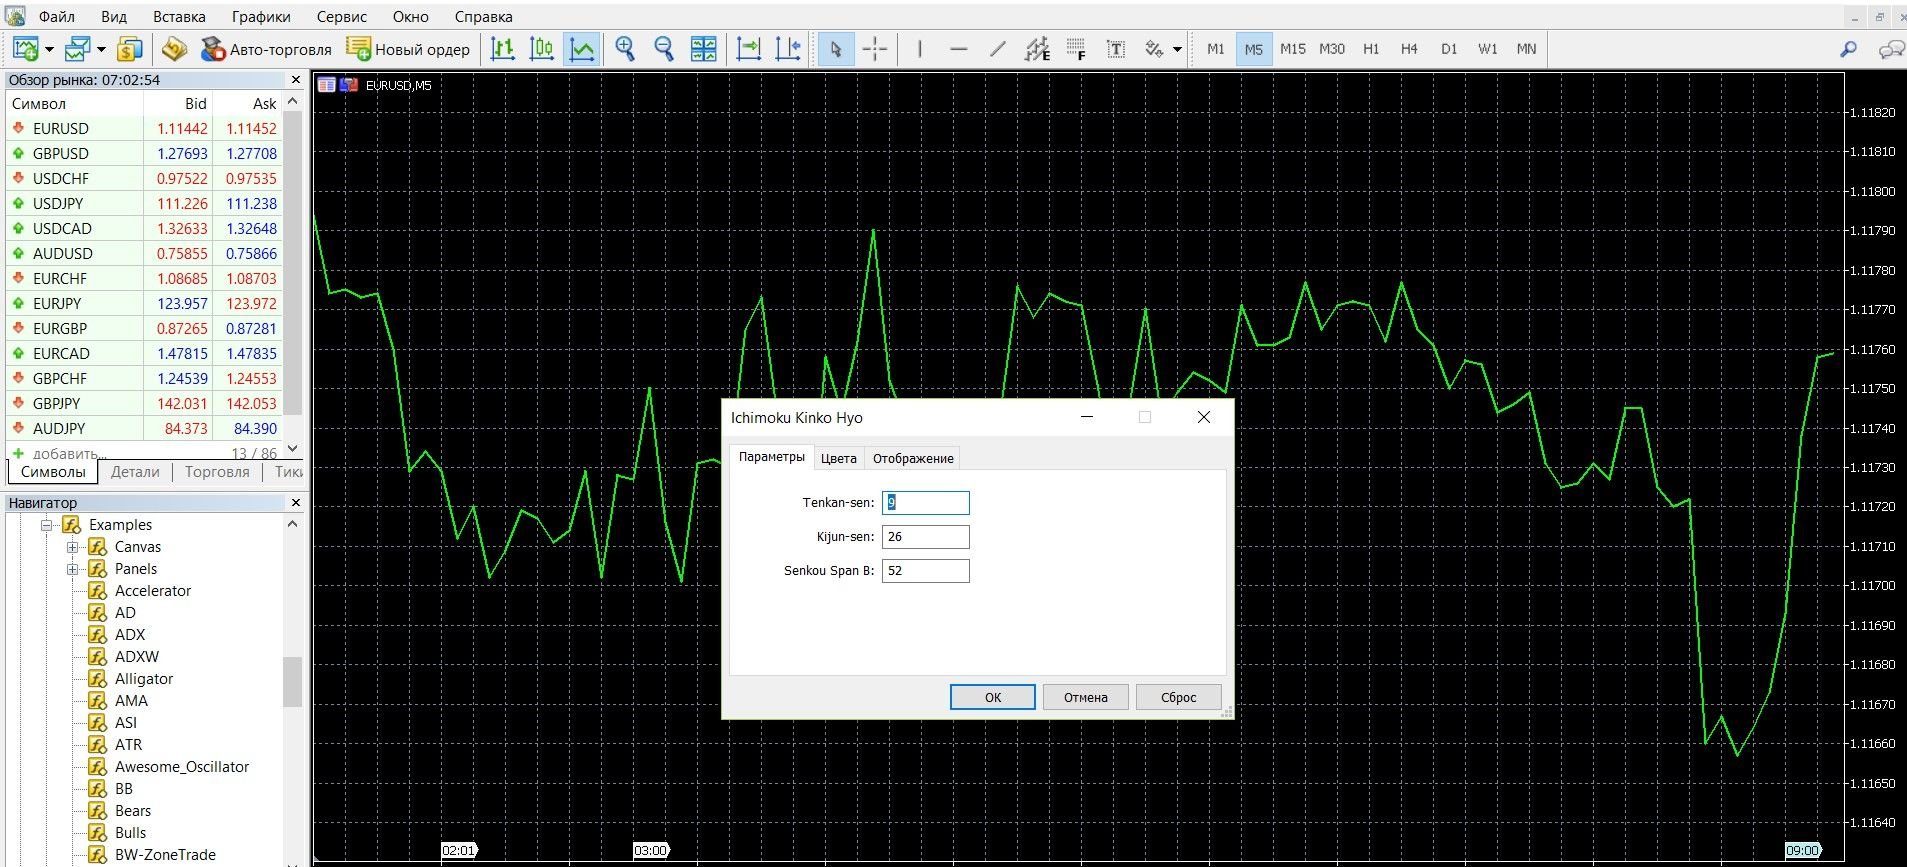
The main settings of the indicator are related to the “Periods” parameter: three time intervals are used to build charts:
- Long, tl – 52 periods (calendar year);
- Average, tm – 26 periods (six months);
- Short, ts – 9 periods (2 months).
According to the author of the indicator, these are the optimal settings for the Nikkei. Most analysts consider this ratio to be optimal for trading, as well as for other markets.
If you work with the trading system at intervals from an hour to a day, it is better to use parameters 120, 24 and 12. If you use the indicator on timeframes from 15 minutes to an hour, it is better to use the parameters 120, 60 and 15. Also, for your strategy, you can configure these parameters yourself.
If your platform doesn’t have an indicator, download it here.
Application of the indicator for binary options
Ichimoku is a classic indicator that originated in Japan, where ancient traditions in the world of finance were founded. It was here that candlestick analysis appeared for trading on the rice exchange. Despite its exoticism, today Ichimoku is quite popular in options trading, its settings are adapted to work in trading.
A unique indicator can be considered a whole trading complex, it is complex and informative, it provides a large amount of useful material on one chart. By working properly with this trading system, you will achieve positive results. When making a choice in favor of Ichimoku, market players evaluate the high efficiency of working with it, the accuracy of signals. Lines react very quickly to the emergence of new extremes, so one of its main advantages (in comparison with moving averages) is efficiency.
This trading system is used more in order to detect market trends. During a market flat, the indicator is recommended to be used with other technical analysis tools, since it is in this case that it is ineffective. The only drawback of the tool is the difficulty of working with it, especially for beginners.
Despite the fact that Ichimoku determines the state of trend and flat, resistance and support, it takes time to begin with to understand the features of its display. And yet, the tool has a lot of fans who successfully work with its data and achieve success.
Rules for concluding transactions (screenshots)
Trading at the intersection of the indicator lines
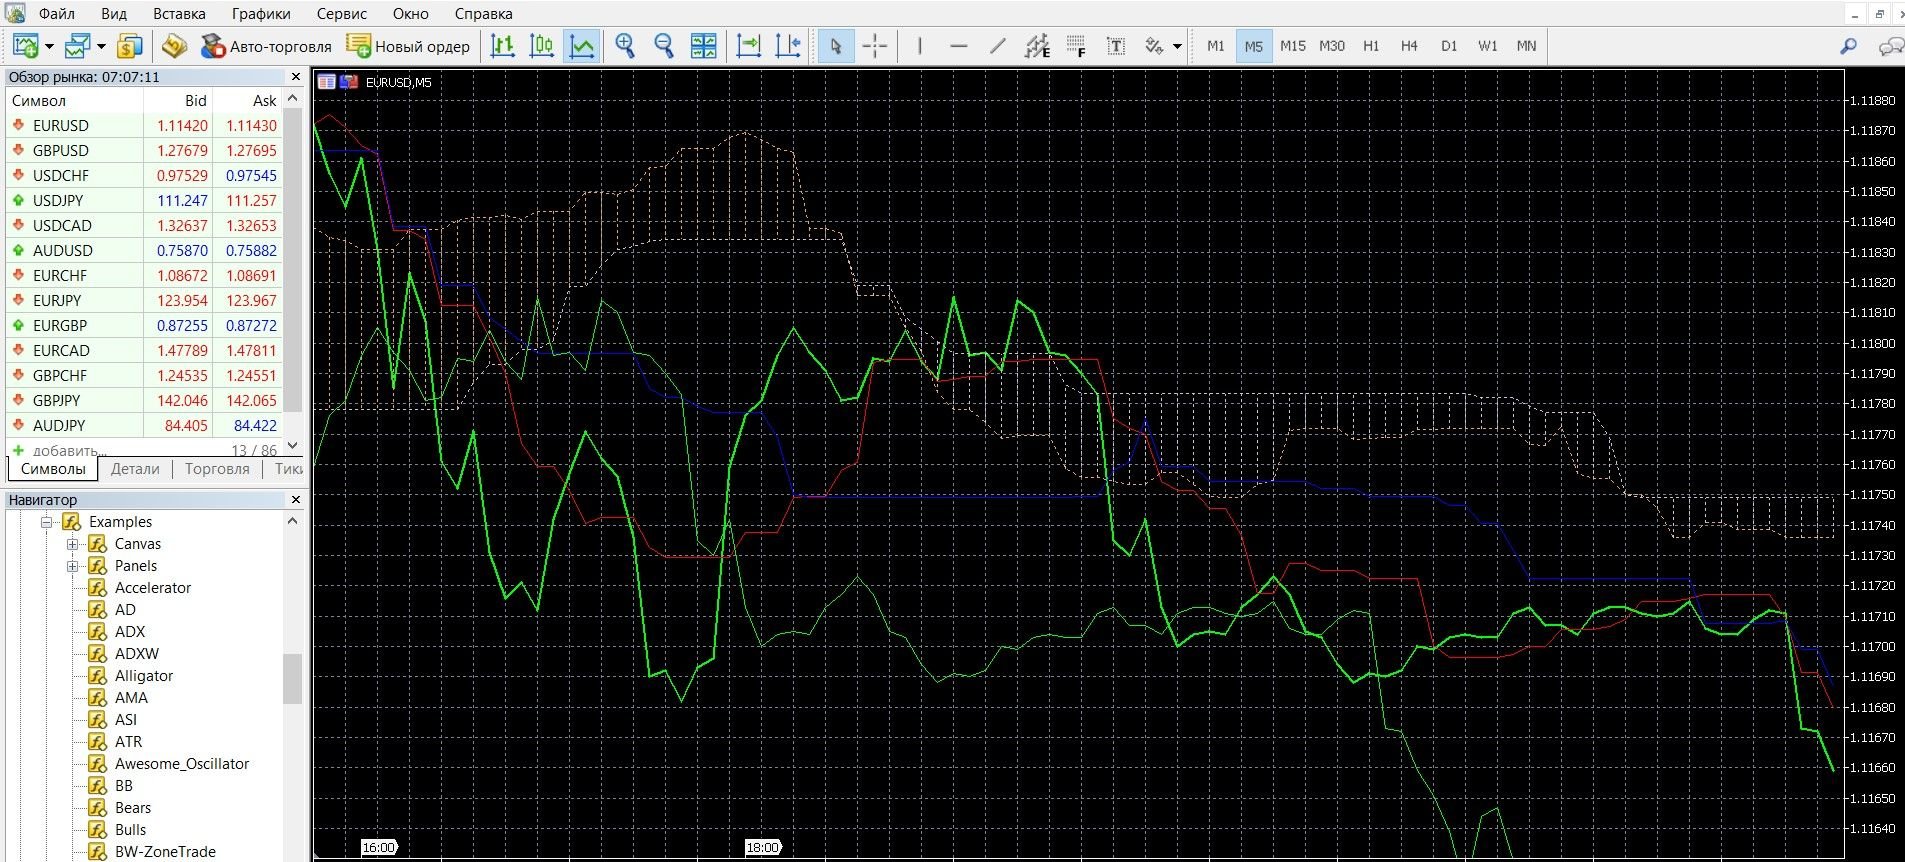
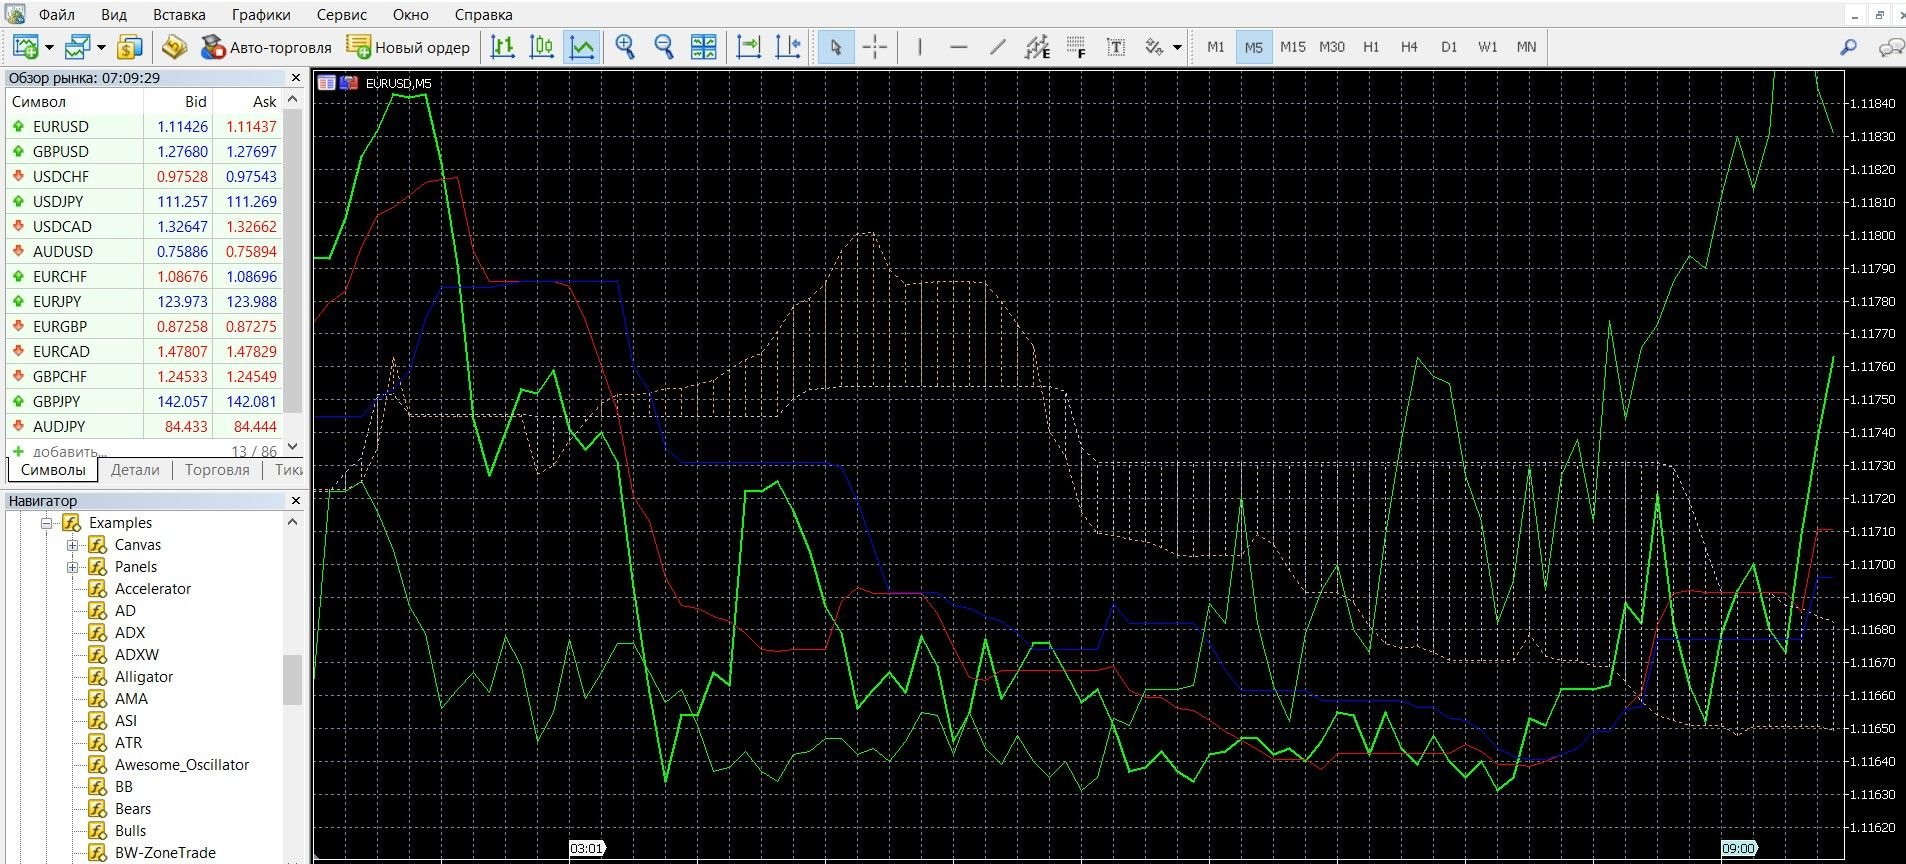
If Senkou Span A is located above the Senkou Span B line, this is a signal to buy a call option. The image below shows the signal of the upward trend of the market on the MetaTrader 4 platform:

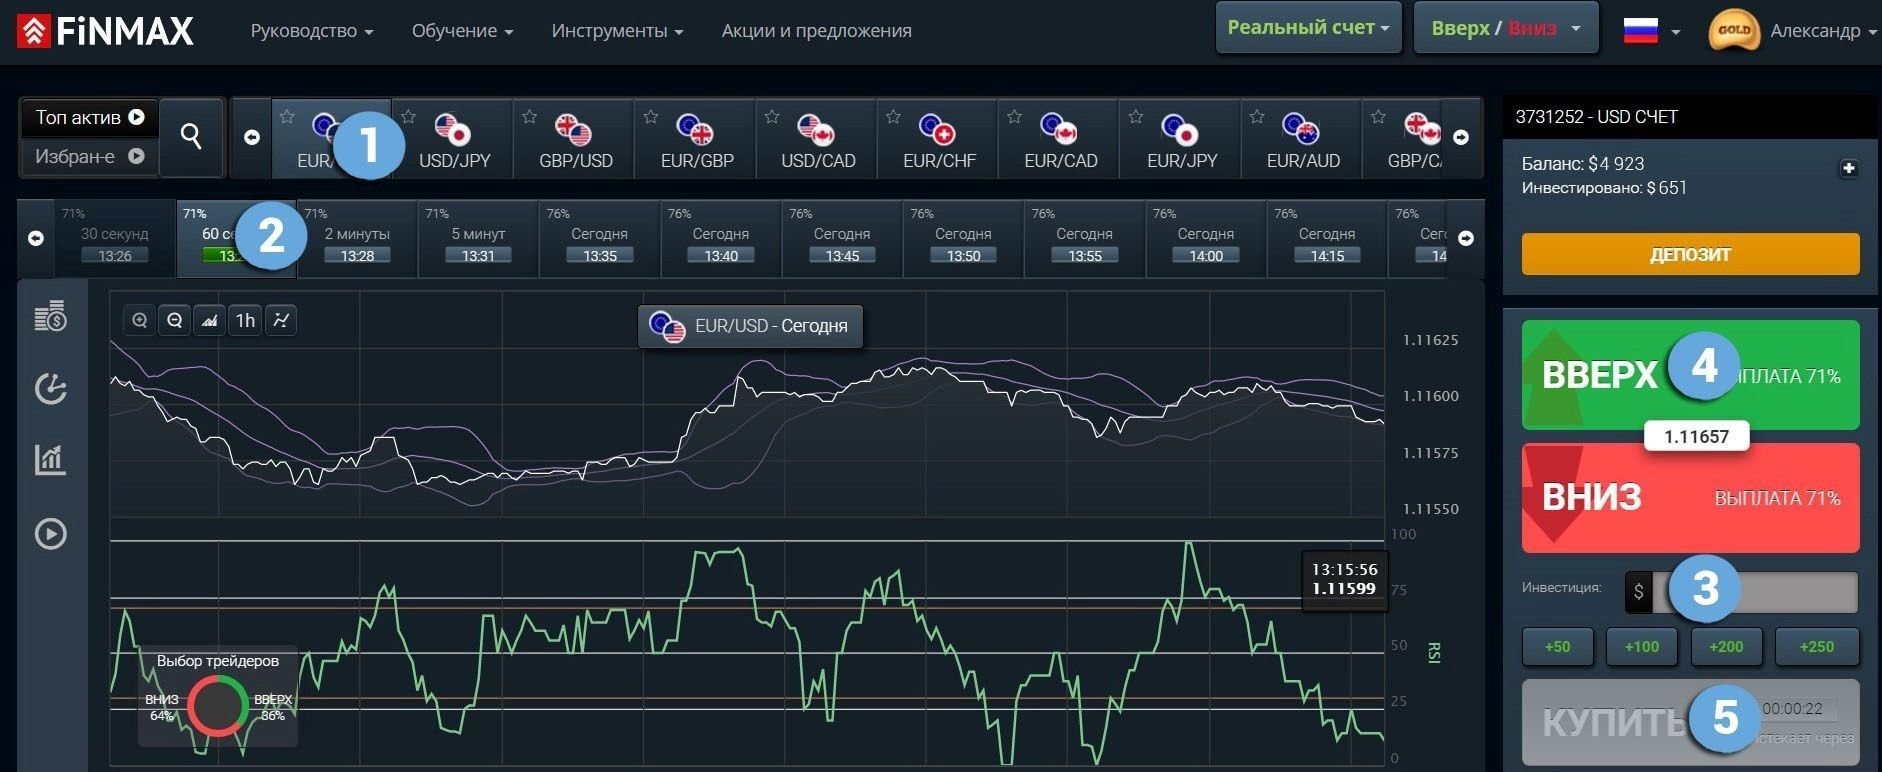
Take advantage of the uptrend opportunities and place a CALL ( up) rate with the Finmax broker. To do this, go to the broker’s website finmaxbo.com and prepare an option, indicating:
- Option
- Expiration
- Bet
- Prediction: UP
- Click the “buy” button and wait for the results:
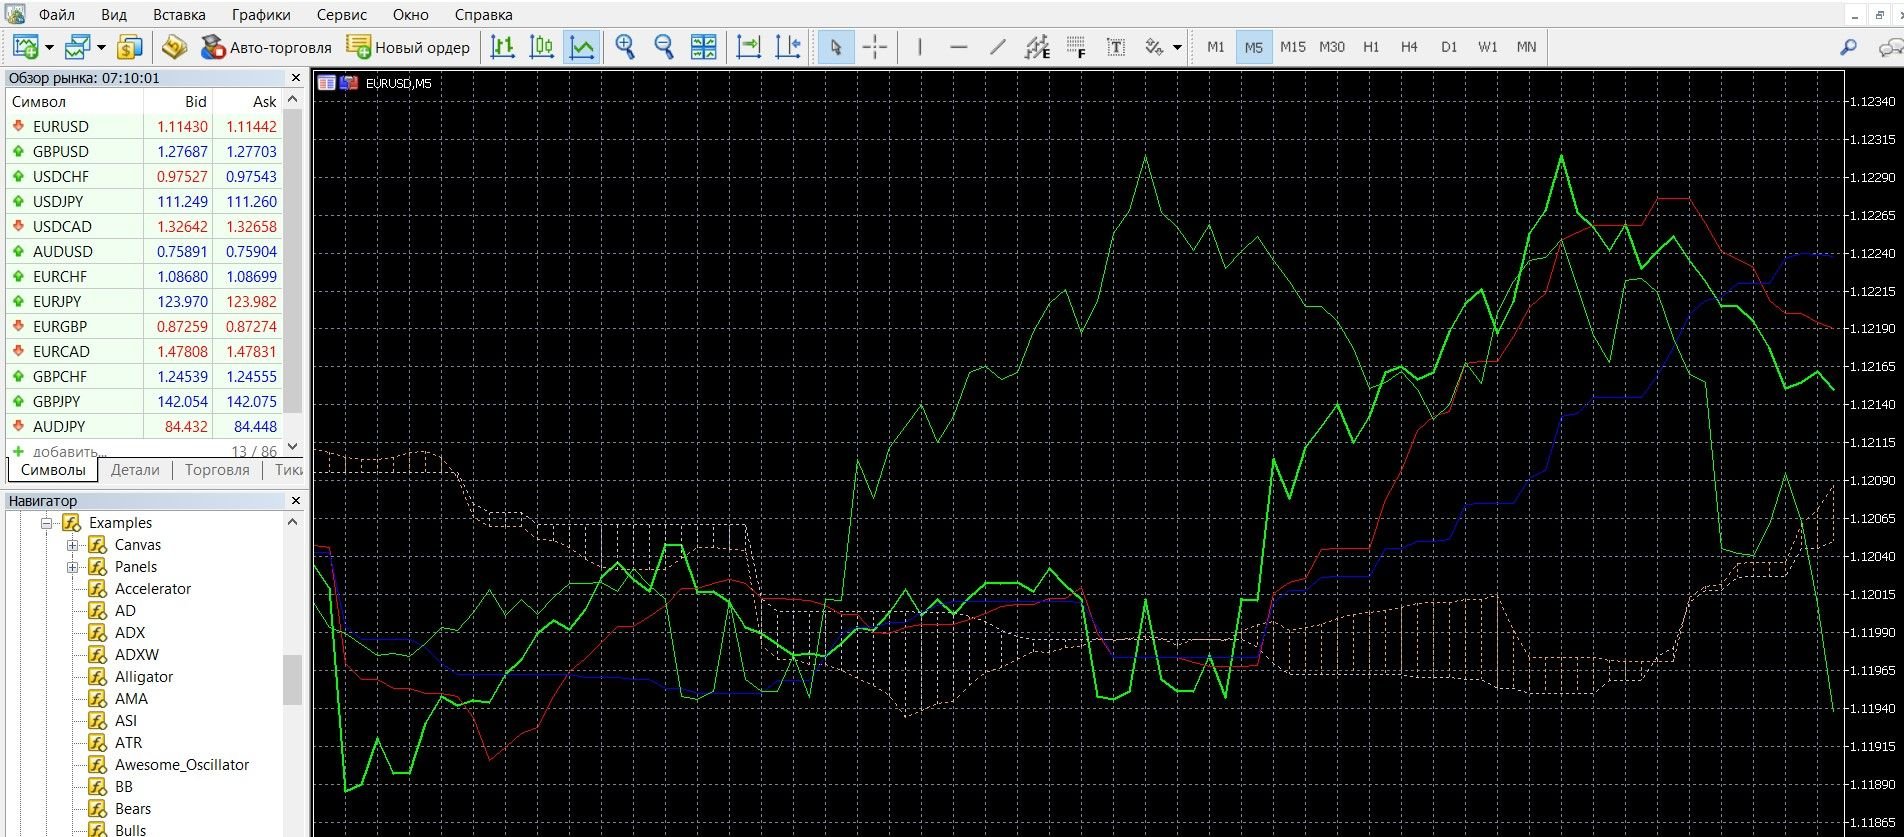
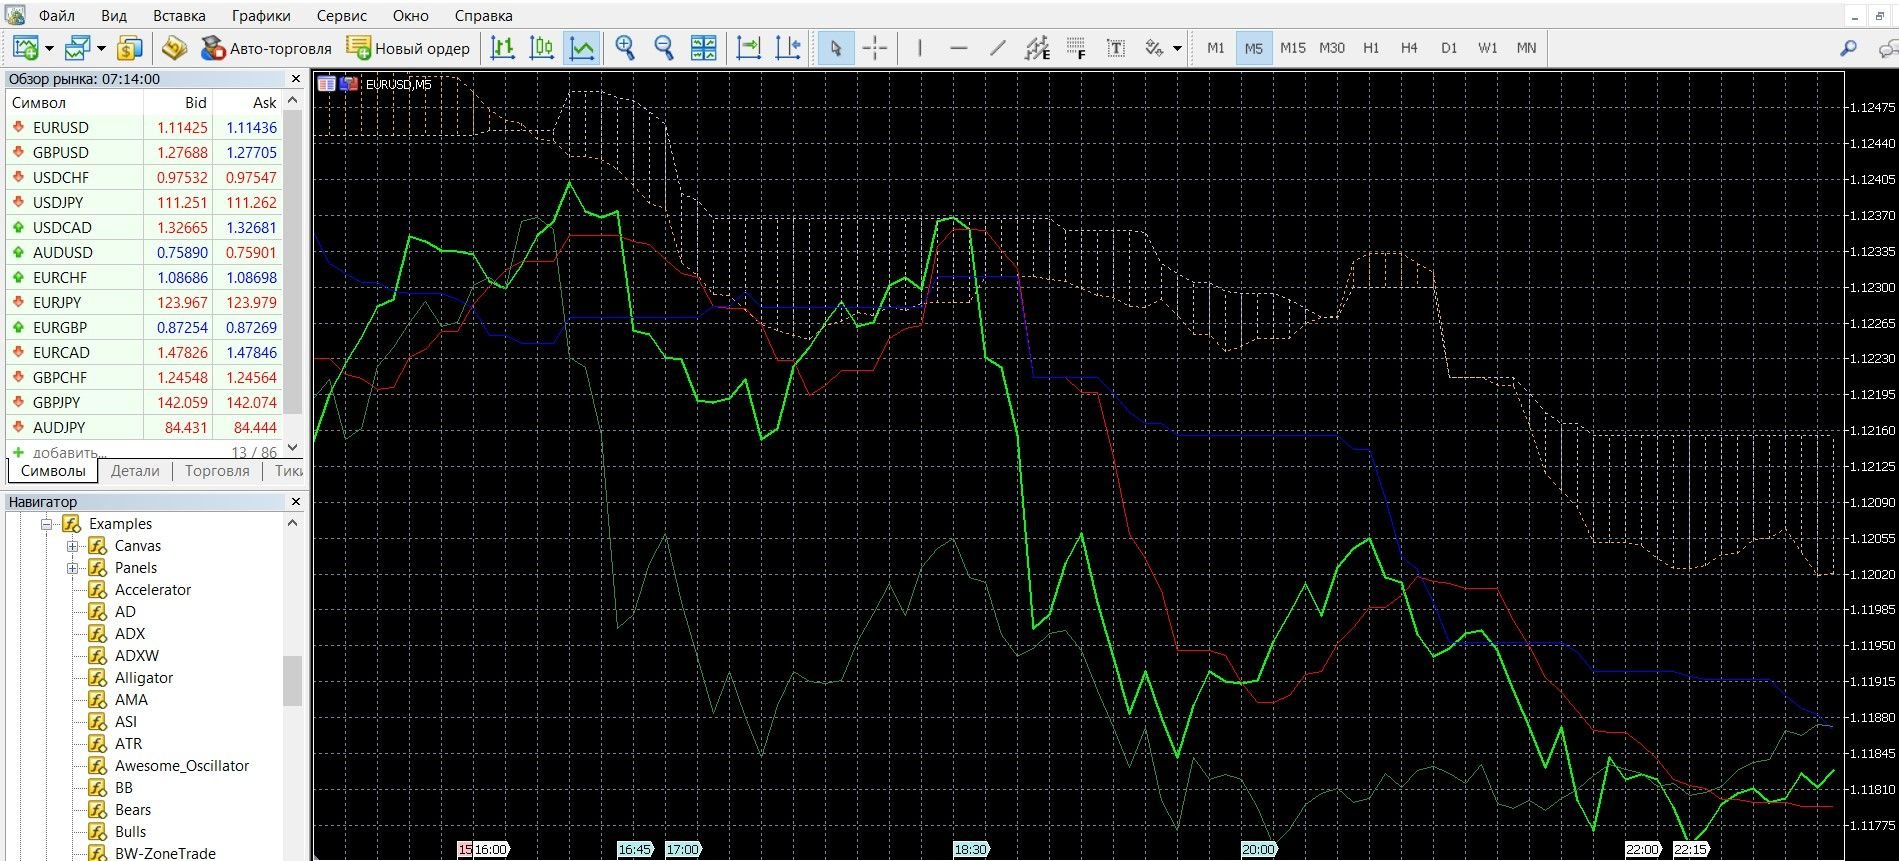
If Senkou Span A is located below Senkou Span B, this is a signal to buy a put option. The image below shows the downward trend of the market on the MetaTrader 4 platform:
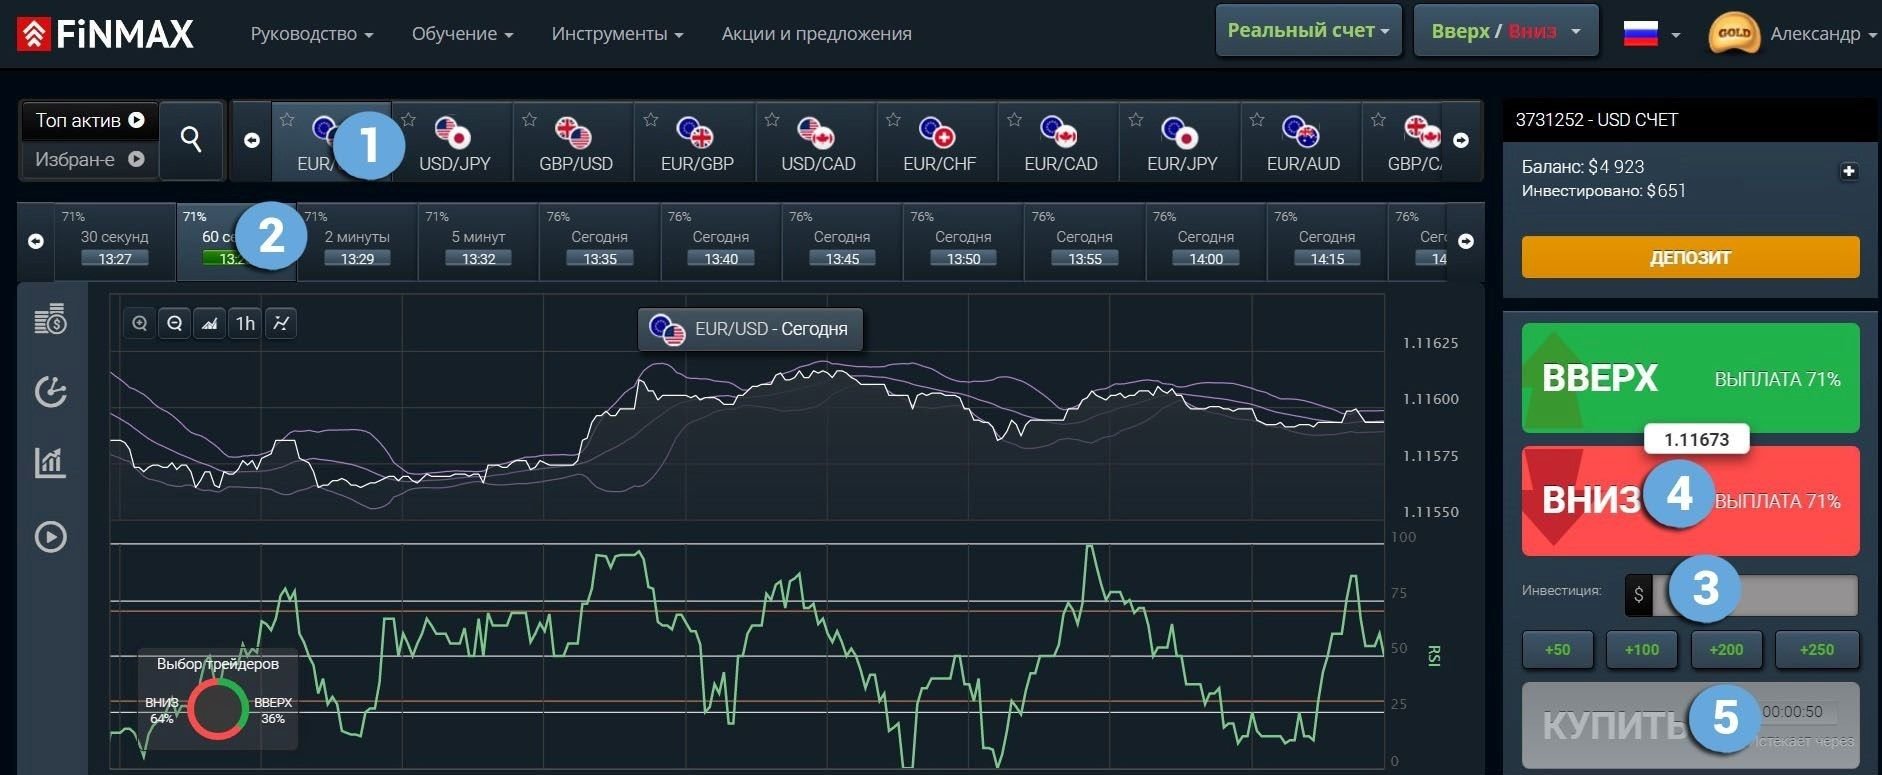
Take advantage of the downtrend opportunities and place a PUT (down) rate with the Finmax broker. To do this, go to the broker’s website finmaxbo.com and prepare an option, indicating:
- Option
- Expiration
- Bet
- Prediction: DOWN
- Click the “buy” button and wait for the results:
Trading with a combination of price and Ichimoku
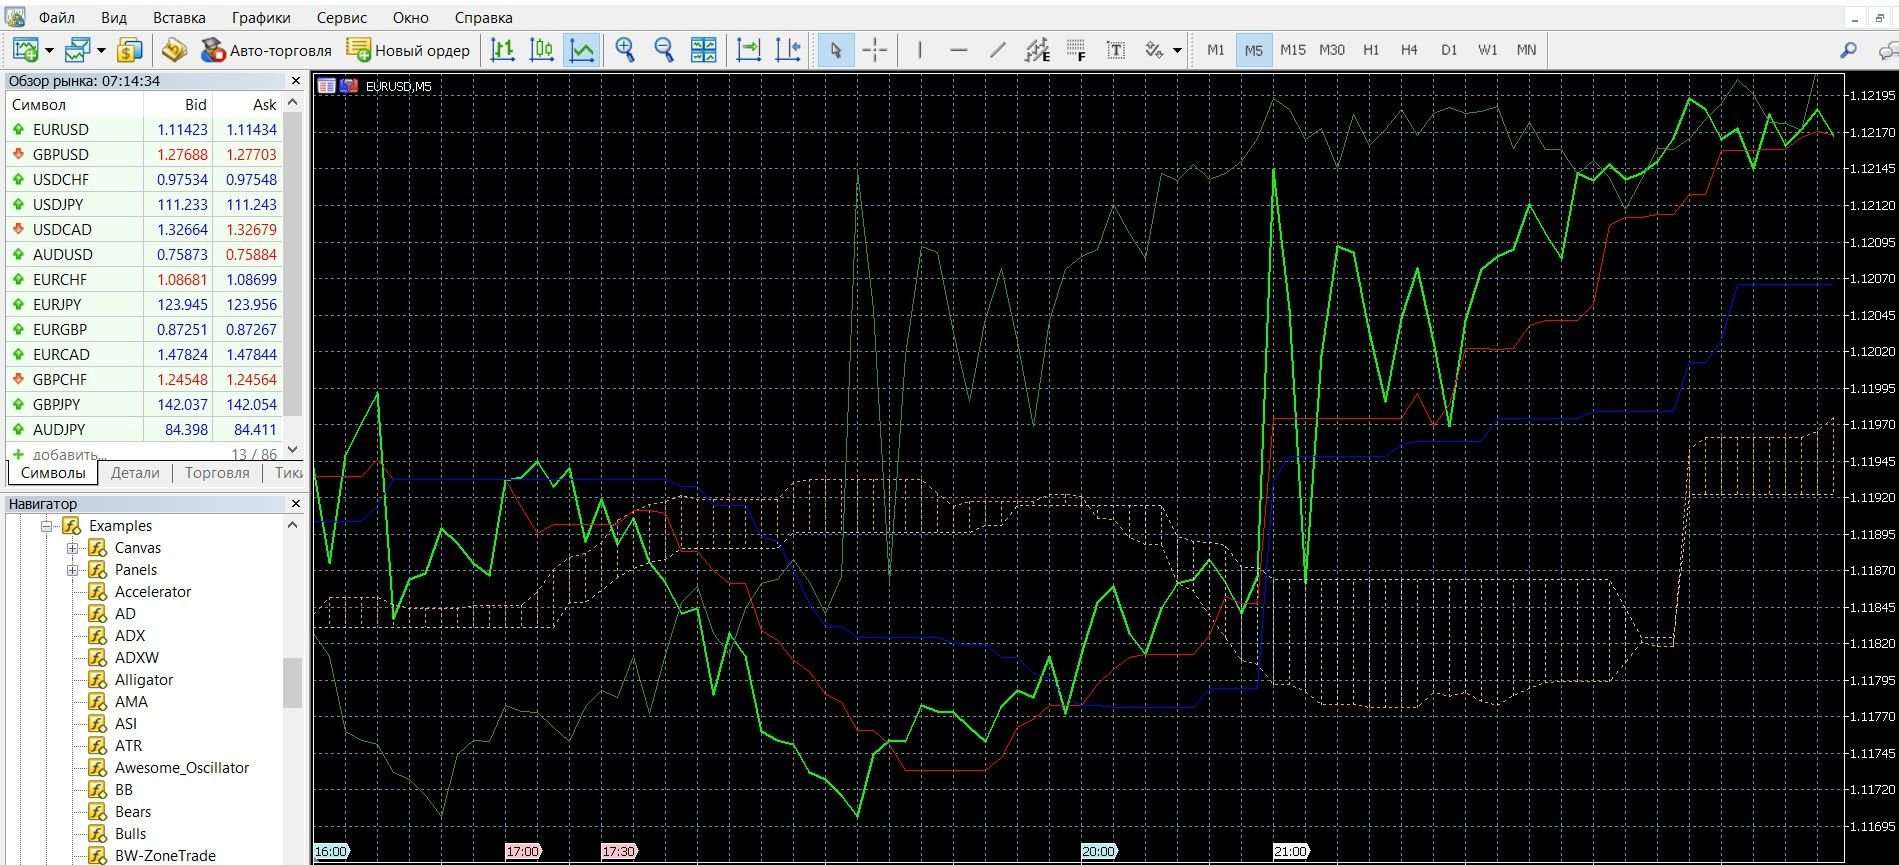
If there is a breakdown of the Tenkan-sen line at the beginning of a trend change, we buy a call option with an uptrend. The image below shows the upward trend in the MetaTrader 4 terminal (you can buy a CALL option on the finmaxbo.com broker’s website, the instructions are listed above):
If there is a breakdown of the Tenkan-sen line at the beginning of a trend change, with a downward trend, we buy a PUT option. The image below shows the downward trend in the MetaTrader 4 terminal (you can buy a PUT option on the broker’s website finmaxbo.com, the instructions are listed above):
Trading with a combination of price and Chinkou Span
If the price crosses the Chinkou Span line from bottom to top, this is a signal to buy call options. The image below shows the upward trend in the MetaTrader 4 terminal (you can buy a CALL option on the finmaxbo.com broker’s website, the instructions are listed above):
If the price crosses the Chinkou Span line from top to bottom, this is a signal to buy put options. The image below shows the downward trend in the MetaTrader 4 terminal (you can buy a PUT option on the broker’s website finmaxbo.com, the instructions are listed above):
Money management
Every trading professional should know the basics of money management, especially if market participants are interested in a stable income. Still, option beginners are also advised to familiarize themselves with these rules as early as possible. The rules of money management are aimed at effective work on the management of capital on the account. How to consciously work with a deposit, how to make sure that money is always saved on it – it is money management that will help you answer these and other questions.
Money management rules:
Trading with a minimum of money: we recommend spending a minimum amount on trading; bet no more than 5% of the deposit on the option; Choose options for participation, the prices of which are less than the amount on the deposit. By following these guidelines, you will save your funds.
Trading with a minimum deposit: we recommend working with a minimum deposit amount; you cannot bet the entire deposit on one option; always keep in mind that the money will still be useful to you; Build a well-thought-out work with the deposit, allocating a free limit that you can trade, it remains only not to go beyond it. By following these guidelines, you will save your deposit.
Trading with a minimum number of assets: we recommend, especially for beginners of options, to initially try your hand at 2-3 assets; Only after you feel confident and gain experience, you can gradually complicate the amount of work by working with several deals. By following these guidelines, you will make trading a productive job.
Trading without emotions: we recommend working in the market in the right mood; always remember that mood determines a lot, especially in dynamic trading; Emotions are what distract, make you distracted and inattentive, emotions interfere with concentration and track the status of the account. By following these guidelines, you will get the most out of your options trading.
Expiration
Like the basics of money management, expiration is the leading concept of trading. Expiration is the moment of expiration of the option, when all trading participants understand the results of forecasts and whether there will be a profit on the deposit. Proper work with expiration helps to build an effective strategy. If you need a stable income, be conscious about expiration.
Types of options:
- Ultra-short options – 30 seconds – 5 minutes.
- Short-term options – 10 minutes – several hours.
- Medium-term options – a day – a few weeks.
- Long-term options – a month – six months.
Is it possible to extend the expiration of options?
You can, if during the auction you suddenly realize that you indicated the wrong result. Not every broker can extend the expiration.
Expiration rules:
- If you are just starting to work with options, pay attention to the possibility of long-term expiration, which is more stable and allows you to reduce the risks of trading several times.
- If you already consider yourself a professional in trading, pay attention to what time period you are more comfortable working with. Work with brokers who allow an increase in expiration during trading, which will reduce your losses if the forecast is incorrect.
- If it is important for you to get a quick income, work with a short-term (a minute – a few hours) expiration, the income from which can be in 30 seconds. Be aware of the unpredictability of express trading.
- If it is important for you to get a stable income, work with long-term expiration, which, unlike turbo options, has a calmer trading mode, the ability to predict the correct forecast, and also get income with minimal risks.
Expiration in Ichimoku Strategies
Expiration in the strategy of crossing the indicator lines
Short-term trading: allowed; It can bring you a good income in the very near future, but always remember about the increased risks.
Medium-term expiration: also allowed; you will be able to get a decent income, but at the same time risk less your capital; To make a decision, you can study the signals of indicators, study the state of the market.
Long-term expiration: allowed; You will be able to prepare well for making a decision by studying the signals of oscillators, using technical and functional analyzes.
Expiration in the strategy withprice accounting and Ichimoku
Short-term trading: allowed; It will bring you a decent income in the very near future, but always remember that turbo trading is characterized by increased risks.
Medium-term expiration: also allowed; will allow you to earn a decent income, but at the same time risk less your capital; To make a decision, you can study the signals of indicators, study the state of the market.
Long-term expiration: allowed; You will be able to prepare well for making a decision by studying the signals of oscillators, using technical and functional analyzes.
Expiration in the strategy of combining price and Chinkou Span
Short-term trading: allowed; will bring you a good income in the very near future, but always remember about the increased risks of express trading.
Medium-term expiration: also allowed; will allow you to earn decent capital, but at the same time risk less your capital; To make a decision, you will have time to study the signals of the indicators, observe the state of the market.
Long-term expiration: allowed; You will be able to prepare well for making a decision by studying the signals of oscillators, using technical and functional analyzes.
Expiration in the “Ichimoku + RSI” strategy
Short-term trading: allowed; Thanks to an unlimited number of trades, you will get a good income, but always be aware of the increased risks of express trading.
Medium-term expiration: also allowed; will allow you to earn decent money, but at the same time risk less your capital; To make a decision, you will be able to study the signals of indicators, observe the dynamics of market forces.
Long-term expiration: allowed; You will be able to prepare for decision-making in more detail using technical and functional analyses, studying the signals of indicators.
When working in trading, determine the expiration that is comfortable for you. A reliable broker Finmax will help you with this. Advantages of the broker: a modern convenient terminal, a large selection of options and expiration dates (from 30 seconds to six months), a simple personal account. To get started, you need to go to the finmaxbo.com website.
Downloads
MetaTrader 4 (MT4) platform – download.
Ichimoku indicator for the MT4 platform – download.
Tagged with: Binary Options Indicator