Strategy using the “Hanging Candlestick Pattern”
Candlestick patterns for binary options strategies, which many traders rely on using market information, can have colorful names. Perhaps there is no more illustrative example than the phrase “hanging candlestick pattern”.
The hanging type of candlestick pattern is a chart that shows high or low prices, opening or closing them for safe trading within one day. Candlestick patterns reflect the influence of investors’ emotions on the value of securities and are used by technical analysts to determine the moments of entry and exit from trading.

The candlestick chart is based on a technique developed in Japan in the 1700s to track the price of rice (there are also many short-term trading strategies based on candlestick patterns such as “harami”, “cross harami”, “evening star”, etc.).
The term “hanged” not only expresses the sinister shape of a candle that looks like a head on top of a hanging body, but also the unfortunate fate of a stock, currency or other asset that has previously experienced a rise in the market. The use of the hanging model will allow you to determine the mood of market participants who are beginning to turn against the investment instrument.
What is “The Hanged Man”?
As with other candlestick formations, the hanged man uses visual representations of stocks opening and closing prices on a given day, depending on their rise and fall. “Hanged” occurs when two main criteria are present: first, this asset was in an uptrend; Secondly, the candle takes the form of a rather short box (“real body”) on top of a long stick (“lower shadow”).
A small upper shadow may or may not appear above the body. What does that mean? While demand is pushing stock prices up for several days, the “hanged” suddenly opens with a significantly cheaper sale, which means that buyers managed to bring the price back to its original level before the close of trading.
Japanese candlesticks are a type of interval chart and a technical indicator used mainly to display changes in stock prices, commodity prices, etc.
A candlestick chart is also called a combination of an interval and line chart in the sense that each of its elements displays the range of price changes over time. Most often used in technical analysis of the market.
Until the stock ended the day significantly lower than when it opened (or slightly higher), the initial sell-off is an indication that an increasing number of investors think the price has peaked. For those who believe in candlestick trading, this is a useful time to shorten your position before a downturn.
Figure 1: The “hanged man” has a small “body” at the top of the long lower shadow:

Hanging candlestick – chart analysis and strategies are based on the behavior of traders in a certain period of time, determining the mood of the market.
Figure 2. The chart below shows a hanging pattern, which is confirmed by the presence of a long red (or black) candle the next day:
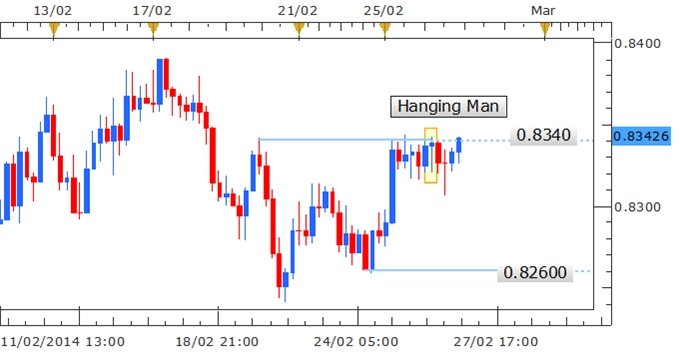
Although traders often rely on candlestick formations to determine the performance of individual stocks, it has a much broader application. “Hanged” is a way of researching volatile assets, with the exception of stocks. In the foreign exchange market, for example, some investors use this form of technical analysis to understand the direction of the world’s currencies.
Features of “The Hanged Man”
What can this candlestick shape mean and give to your trading if you look at it closely? More experienced traders usually look for specific manifestations of the model to confirm the truth of the “hanged man”.
One of the most important indicators here is the length of the lower shadow. If it is a genuinely “hung” specimen, then the thin vertical line will be at least twice as long as the body. This will suggest that a significant sell-off is possible, followed by a surge by the end of the day, which will lead to a price condition close to the opening of the market.
 Thomas Bulkowski in the “Encyclopedia of Candlestick Charts” suggests that the longer the lower shadow, the more significant the picture becomes. Using historical market data, he studied about 20,000 forms of the “hanged man.”
In most cases, shapes with elongated shadows differed from shapes with reduced shadows. Some traders look for strong trading volumes during the breakout at the beginning of the day.
Bulkowski’s research also supports this view. Of the many candlesticks he analyzed, those with heavy trading volume were better predictors of the situation than those with light trading volume. Another important fact is the presence of confirmation of the candle the day after the appearance of the “hanged man”, which can manifest itself in several different ways.
One way to confirm a candlestick is to look for a “deletion open” when the next trading day starts lower than its previous closed asset. Another option is to look at the closing prices the day after the hanged man formation appears. If a stock or other commodity asset closes lower, traders using technical analysis can be confident in the upcoming economic downturn. According to T. Bulkovsky, such cases foreshadow a price reversal in 70% of cases.
It is worth noting that the color of the “hanged” in this case does not matter, while some traders believe that the black box (or red, depending on the software you use) adds power to the candle, others argue that the color of the candle should not be considered any important factor.
The question of the reliability of the “Hanged Man”
“Hanged” is one of the most commonly used candlestick patterns in the investment world, so it has many of its supporters. This does not necessarily make it a reliable indicator for setting the price of a favorable turnaround, however, it is considered to be a fair predictor of the market situation.
 T. Bulkovsky refers to those traders who consider the formation of the “hanged” to be unreliable. According to his analysis, the upward trend in prices actually continues a slight majority of the time when the “hanged man” appears on the candlestick chart.
There is an important caveat: when the lower shadow is enlarged, or if there is confirmation of a candlestick, it becomes a much more useful tool. If you are patient and looking for a lower price opening or closing for the next day, the chances of a price reversal will increase significantly.
Strategy “Hanging candlestick model” at the broker Binomo
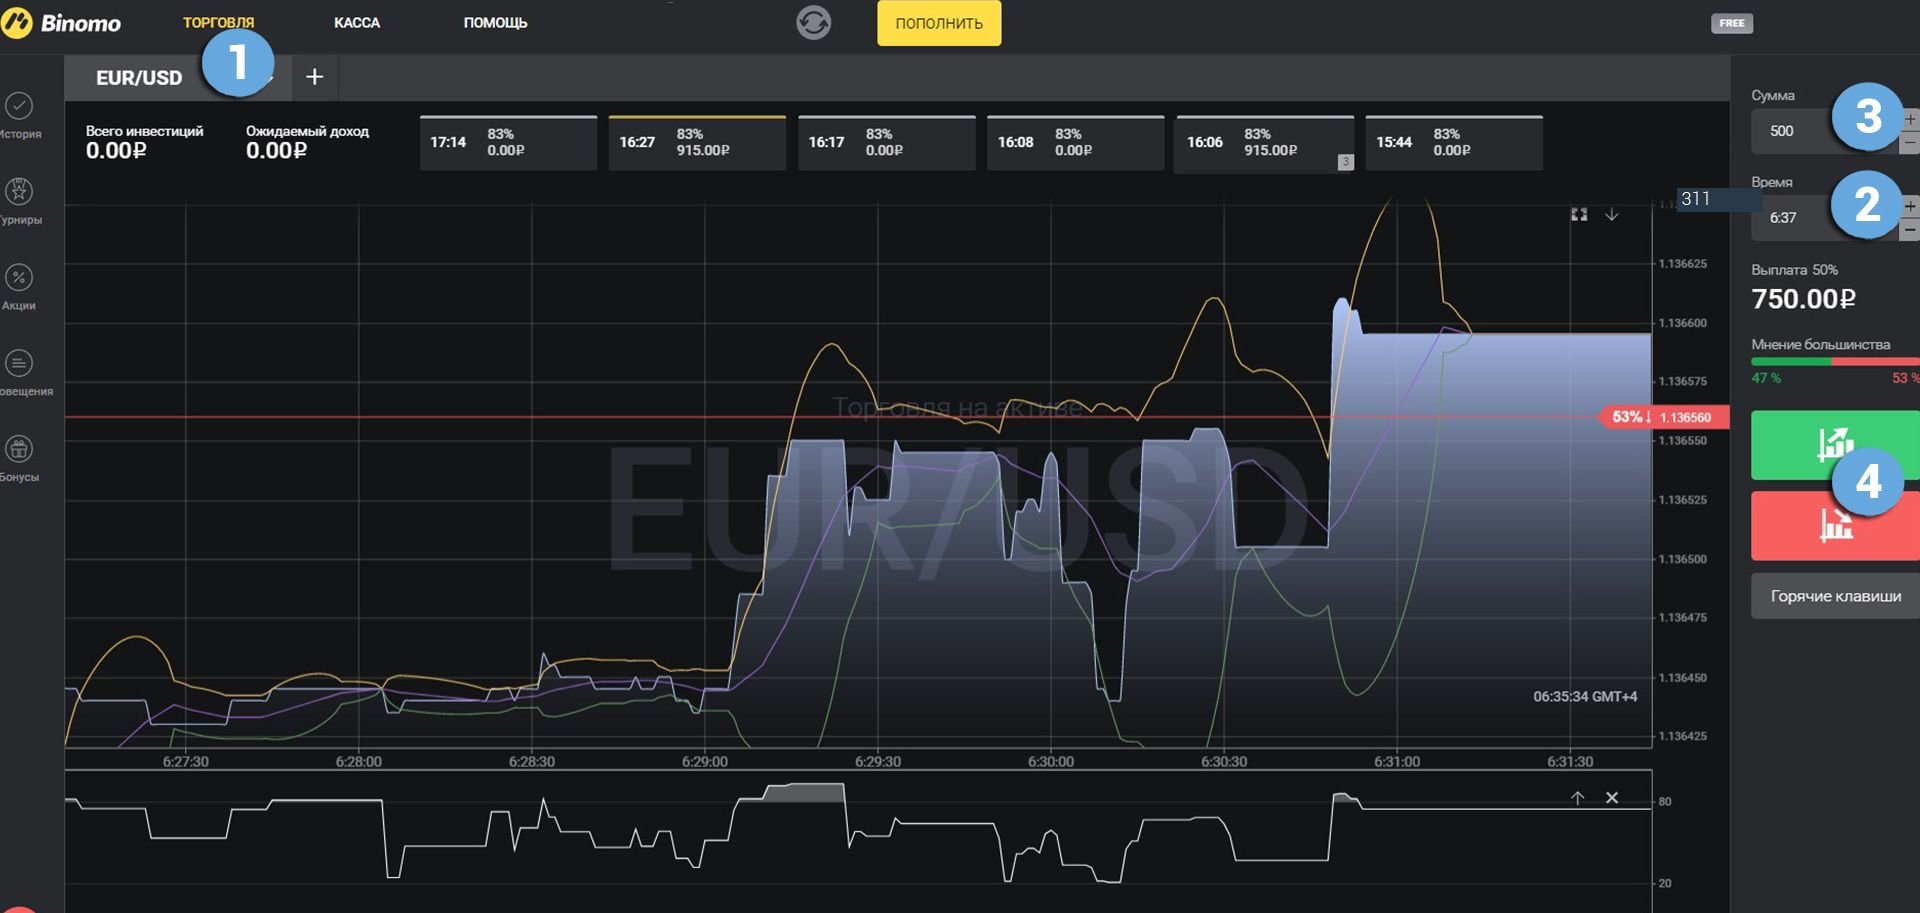
To work most effectively on the “Hanging candlestick model” strategy, use the terminal of the leading binary options broker in our country Binomo. One of the most functional platforms offers advanced customization options: chart type, option types and expiration dates, indicators and their settings, technical analysis, etc.
Also, the broker offers its users convenient withdrawal and deposit of funds, promotions and bonuses, the ability to use mobile trading. You can get acquainted with real reviews about the Binomo broker, as well as get involved in an active discussion of active traders here.
A detailed review of the Binomo broker is here.
Go to the official website of the Binomo broker here.
In order to buy a
CALL
option in the Binomo trading terminal, follow these steps by going to the binomo.com website and preparing the option, indicating:
- Type of asset
- Expiration
- The size of the bet
- Forecast of quote movement: UP
- Click the “buy” button and follow the results.
In order to buy
a PCI
option in the Finmax trading terminal, follow these steps by going to the binomo.com website and preparing the option, indicating:
- Type of asset
- Expiration
- The size of the bet
- Forecast of quote movement: DOWN
- Click the “buy” button and follow the results.
Bonuses broker Binomo
A significant advantage of Binomo is a lot of different promotions and offers, which you can find here. Working on the platform using bonuses, the trader not only gets a good chance of a decent income, but can also get the most out of trading faster.

Binomo Weekly Tournament
Weekly free tournaments from Binomo are an opportunity to get real money without your own investments. They can be withdrawn in any convenient way or put into trading with a broker. Such tournaments are held on Thursdays, traders with any experience who have a demo account with a broker can participate in them. The main prize, which is awarded to the winner with the highest profit during the tournament, is options in the amount of $ 150.
Take part in the Binomo tournament
Findings
The “hanged” model is one of the most famous and widely sought-after models in the world. However, the shape itself is a relatively weak indicator that the uptrend is coming to an end. When investors wait all day for the candle to be confirmed, the chances that the downturn will actually take effect increase.
Tagged with: Binary Options Strategies Chart Models • Binary Options Strategy