
RVI indicator
Description
Now the Internet has become not only a way of simple communication, but also a platform for additional income. Freelancing is a remote job that attracts an increasing number of network users. Indeed, the idea of getting quick real money looks tempting, despite the fact that you can work where it is convenient and as much as you like. Freelancing is also trading, which offers you a free work schedule, the opportunity to improve your skills, achieve more and more new goals, but at the same time it is options trading that gives you some of the fastest money on the network – from 30 seconds.
Such work attracts many, so trading has become widespread. Anyone can make it their main job and get decent money. To do this, it is important to increase the level of knowledge, study strategies, test indicators, and always be aware of broker ratings. Even more useful things (Trader’s Academy, broker shares , etc.) are available to you on our portal. To be a professional market player, use the materials at any time. Today we will talk about the RVI indicator.
The Relative Vigor Index (RVI) is a popular technical binary options indicator authored by economist John Ehlers, who also created Laguerre and the Center of Gravity. The tool first appeared in 2002, and since that time it has become one of the most common among exchange players. Today, the indicator is considered an original analytical tool and, having received wide recognition, is used not only in trading, but also in the Forex market.
RVI can easily be attributed to oscillators, but, unlike them, it does not display overbought and oversold zones. Its significant advantage is that it accurately shows the strength and duration of the trend.
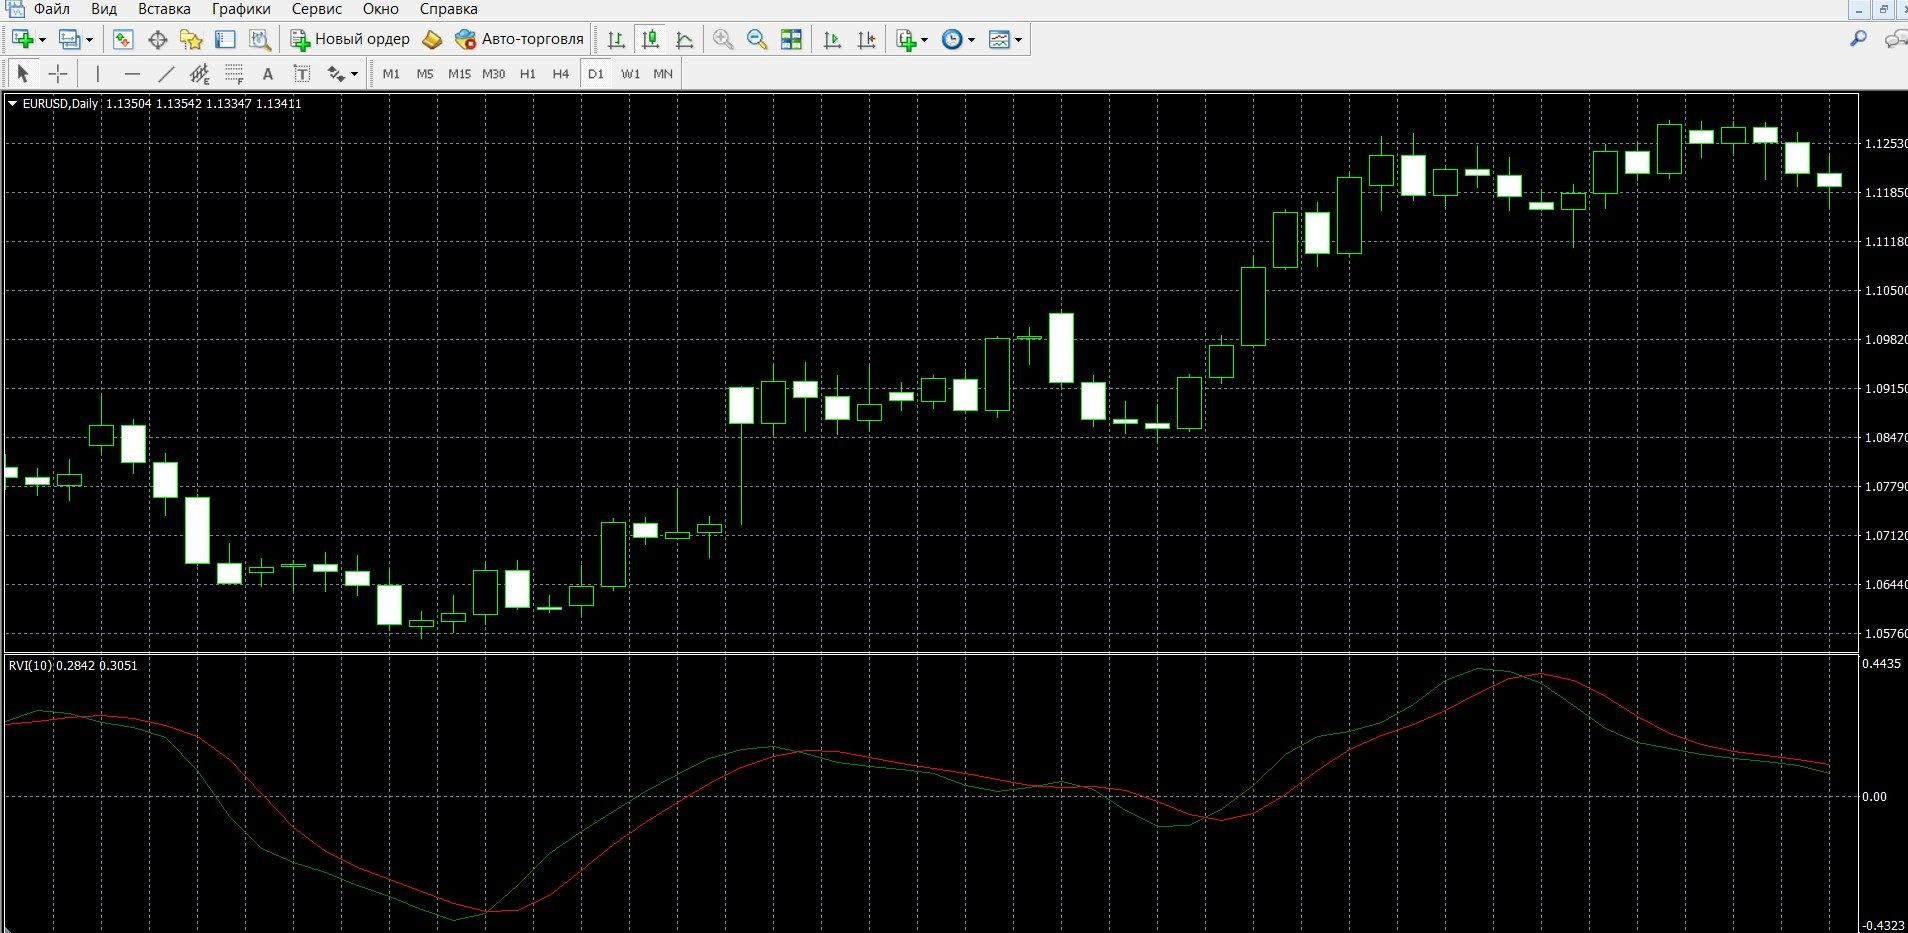
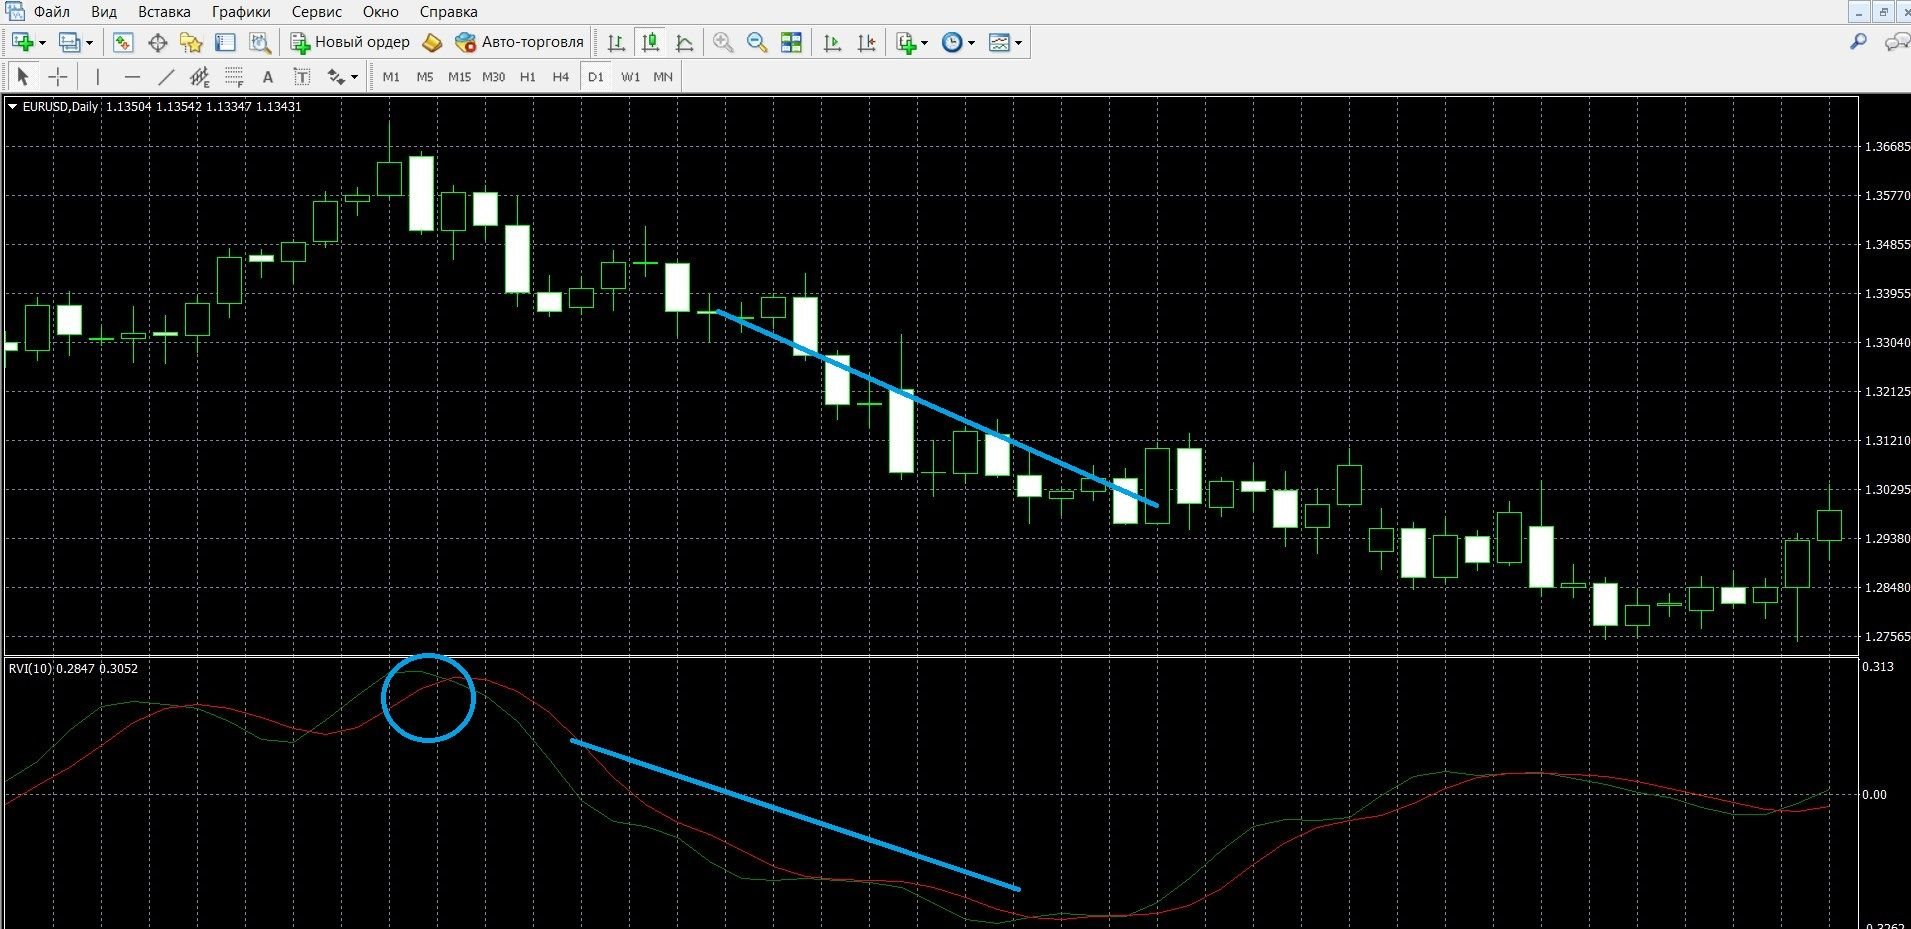
You can see how the RVI looks visually on the MetaTrader 4 price chart in the image below. You can also download the MetaTrader 4 platform and learn more about the indicator.
What is the working principle of the RVI indicator?
The author of the indicator, J. Ehlers, carried away by the study of market cycles, was able to add a powerful mathematical apparatus to technical analysis. The Relative Vigor Index is similar to the Relative Strength Index (RSI). He also continues the topic of trend movement analysis. But unlike the RSI, which shows the ratio of two types of bars on the chart, the RVI determines the ratio of lengths.
Observing asset quotes, the scientist saw that in the case of an active uptrend, not only white candles become larger, but the bodies of these candles themselves are large, in contrast to the downtrend, which has the opposite picture. This phenomenon was called the “cheerfulness” of the trend, and the instrument became its index. With this approach, the idea of the market as a mechanism is clearly reflected, the bodies of the candlesticks of which indicate the confidence of the participants in the transaction, and their shadows indicate doubts about the choice of position. On the price chart, the indicator is displayed in a separate window, has the form of two curves:
- Fast (blue), reflecting the energy of market dynamics. It is based on the fact that the price closes higher than it opened, shows the state of equilibrium of the market crowd for a specific short time period.
- A slow signal line serves to reflect the equilibrium state of the market crowd over a long period of time.
The combination of these lines gives standard crossover signals for oscillators:
- If the fast line of the indicator crossed the slow one in the direction from bottom to top, this indicates that there is an uptrend on the stock exchange at the moment, it is worth buying CALL options,
- If the fast line of the indicator crossed the slow one in the direction from top to bottom, this indicates that a downtrend is currently formed on the exchange, it is worth buying PUT options.
In many ways, it resembles oscillators (e.g., RSI, Stochastic, CCI , or Williams %R percentage range).
RVI Calculation Formula
VALUE1 = ((CLOSE – OPEN) + 2 * (CLOSE (1)) – OPEN (1)) + 2*(CLOSE (2) – OPEN (2)) + (CLOSE (3) – OPEN (3))) / 6
VALUE2 = ((HIGH – LOW) + 2 * (HIGH (1) – LOW (1)) + 2*(HIGH (2)- LOW (2)) + (HIGH (3) – LOW (3))) / 6
NUM = SUM (VALUE1, N)
DENUM = SUM (VALUE2, N)
RVI = NUM / DENUM
RVISig = (RVI + 2 * RVI(1) + 2 * RVI(2) + RVI(3)) / 6, where:
OPEN — opening price;
HIGH — maximum price;
LOW — minimum price;
CLOSE — closing price;
VALUE1 — symmetrically weighted smoothed average of the values of the differences between the closing and opening prices of the bar;
VALUE2 — symmetrically weighted smoothed average of the values of the differences between the maximum and minimum prices of the bar;
NUM is the sum of N values of VALUE1;
DENUM is the sum of N values of VALUE2;
RVI — value of the Relative Vigor Index indicator of the current bar;
RVISig — value of the RVI signal line of the current bar;
N is the smoothing period.
Info taken from website mql5.com
Indicator signals
Trend signals:
- If the RVI curves are rising, this indicates an uptrend, it is recommended to buy call options,
- If the curves, on the contrary, are decreasing, we have a downtrend, it is recommended to buy PUT options.
RVI line crossing signals:
- If the fast line (green) crossed the slow (red) in the bottom-up direction, this indicates that there is an uptrend on the exchange at the moment, it is worth buying call options,
- If the fast line (green) crossed the slow line (red) in the direction from top to bottom, this indicates that a downtrend is currently formed on the exchange, it is worth buying put options.
Do I need to install the RVI indicator in your platform?
The RVI indicator is a non-standard trader’s tool that is not included in the basic list of MetaTrader 4 indicators. You can download it for free and quickly from our website here. Then install the downloaded file in MT4 using the simple instructions here.
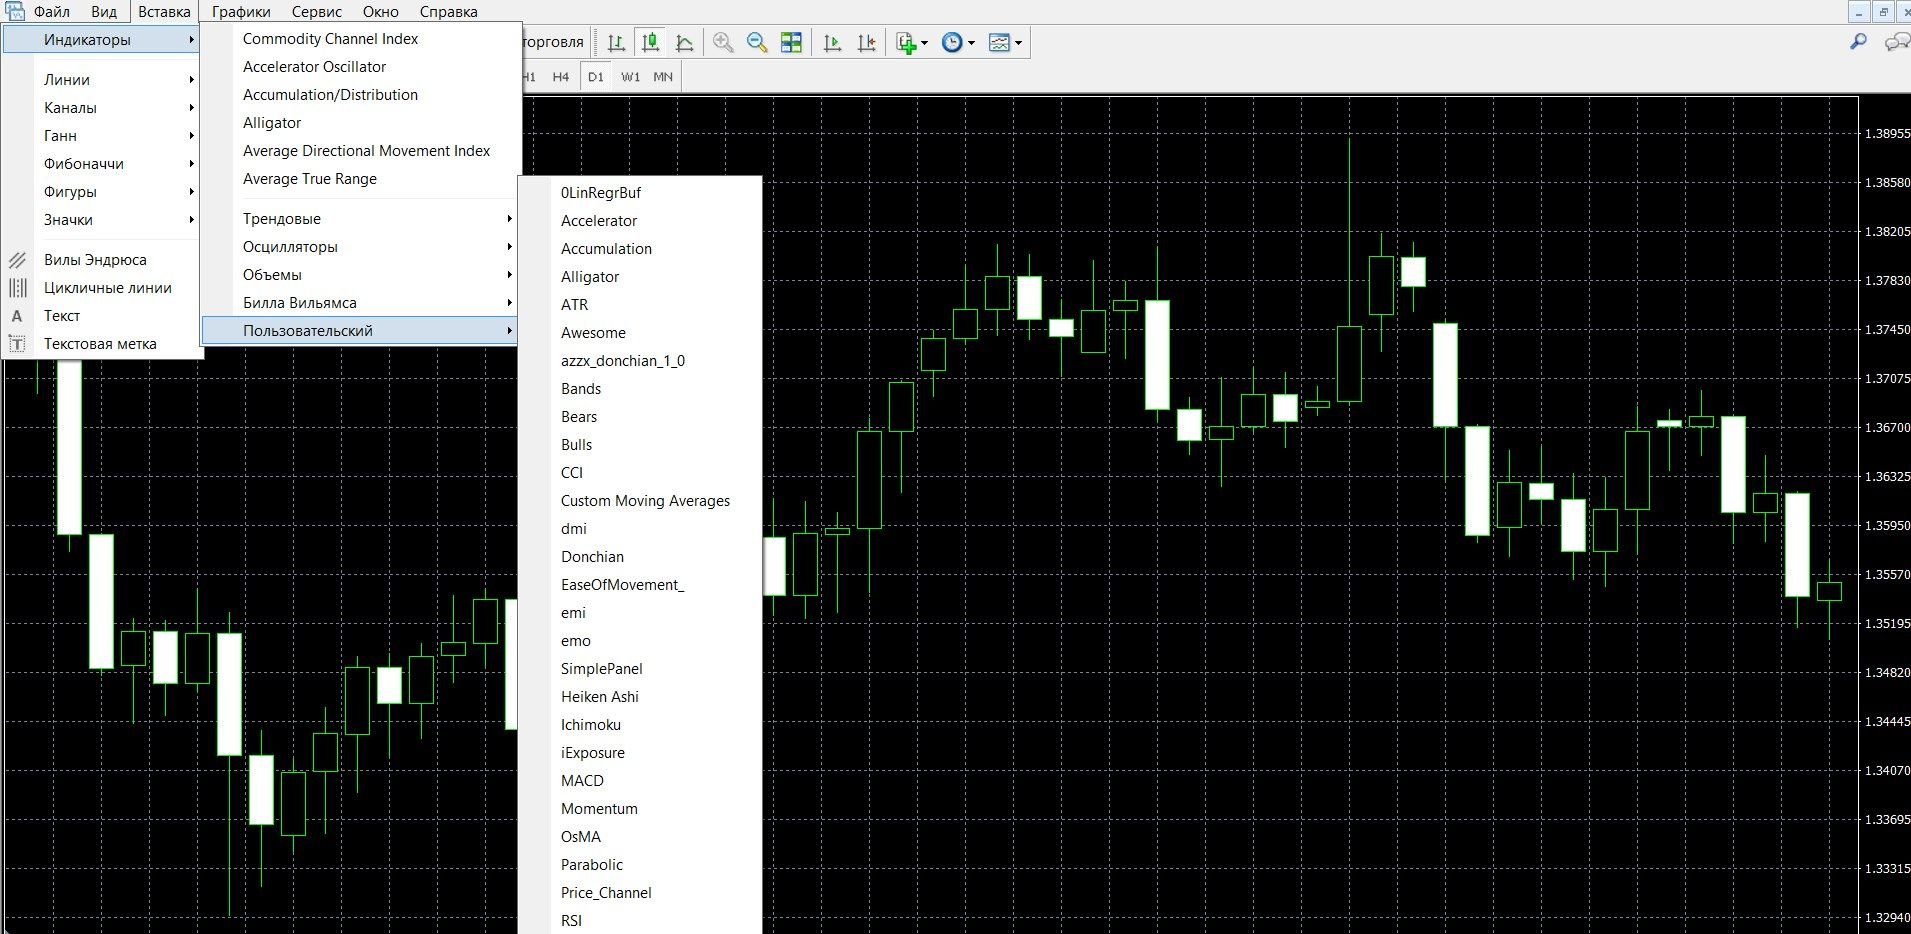
After installation, add the indicator to the price chart, for this:
- Click the “Insert” tab in the top menu of the platform
- Select the tab “Custom” – “RVI”.
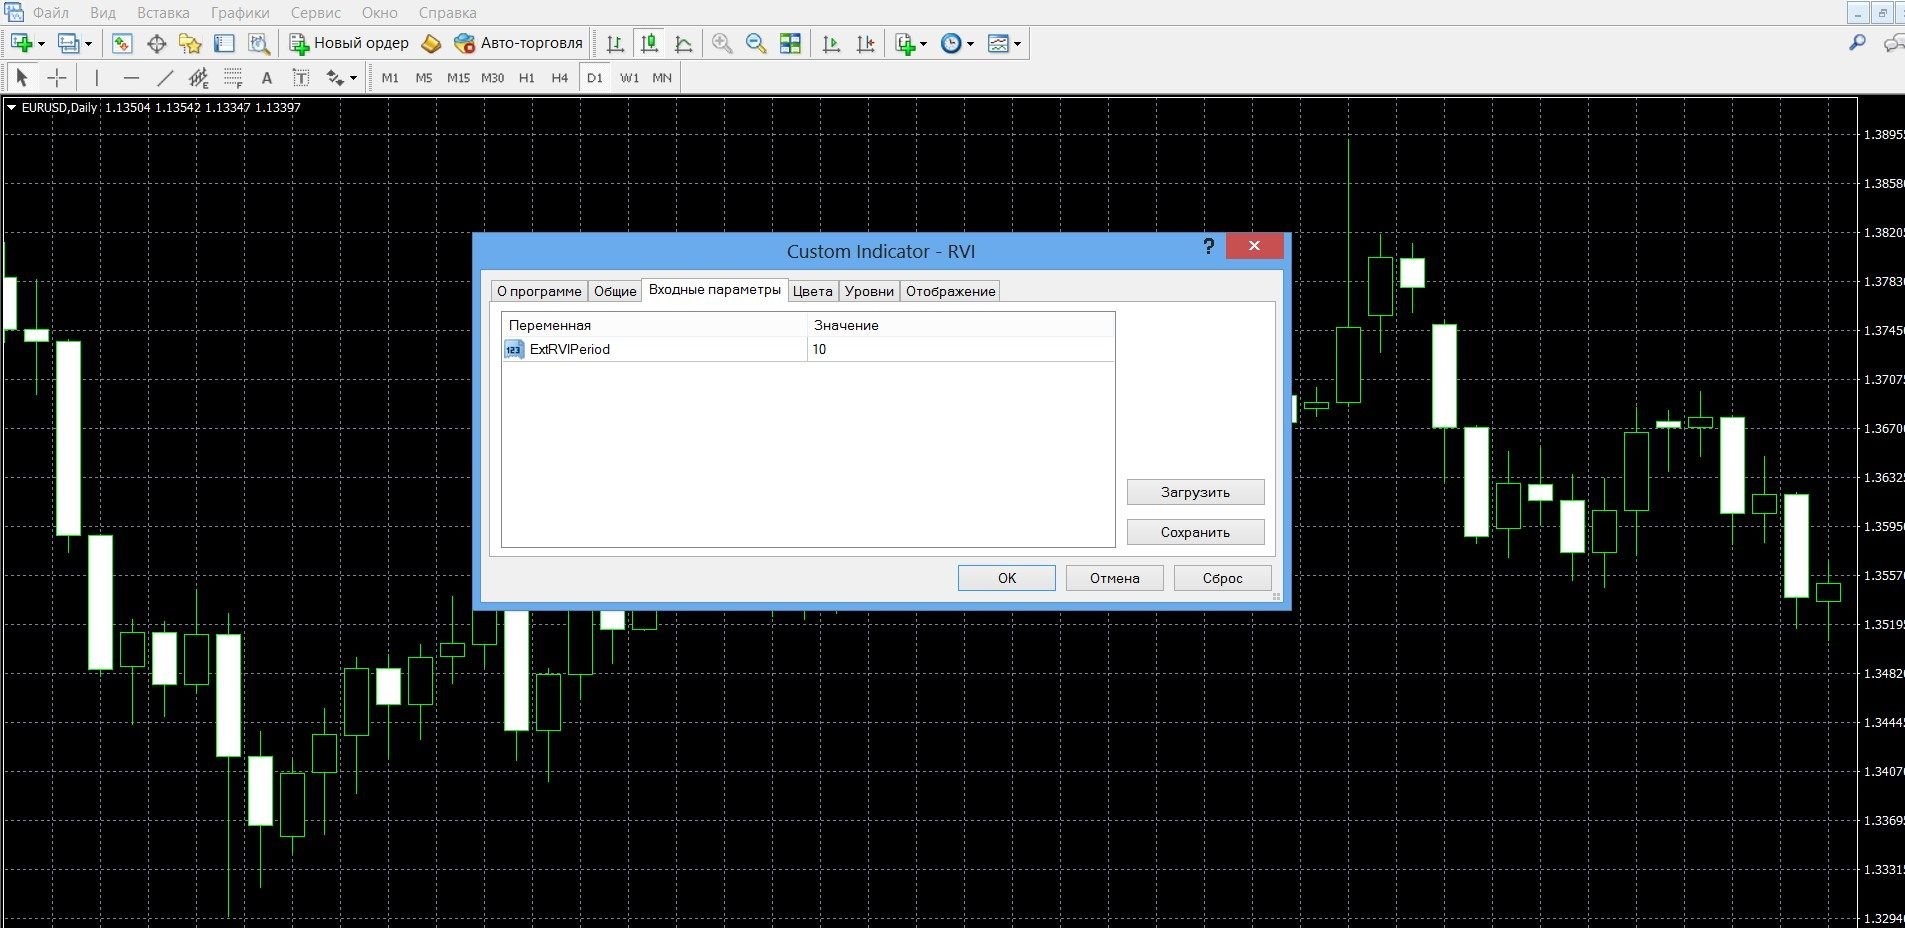
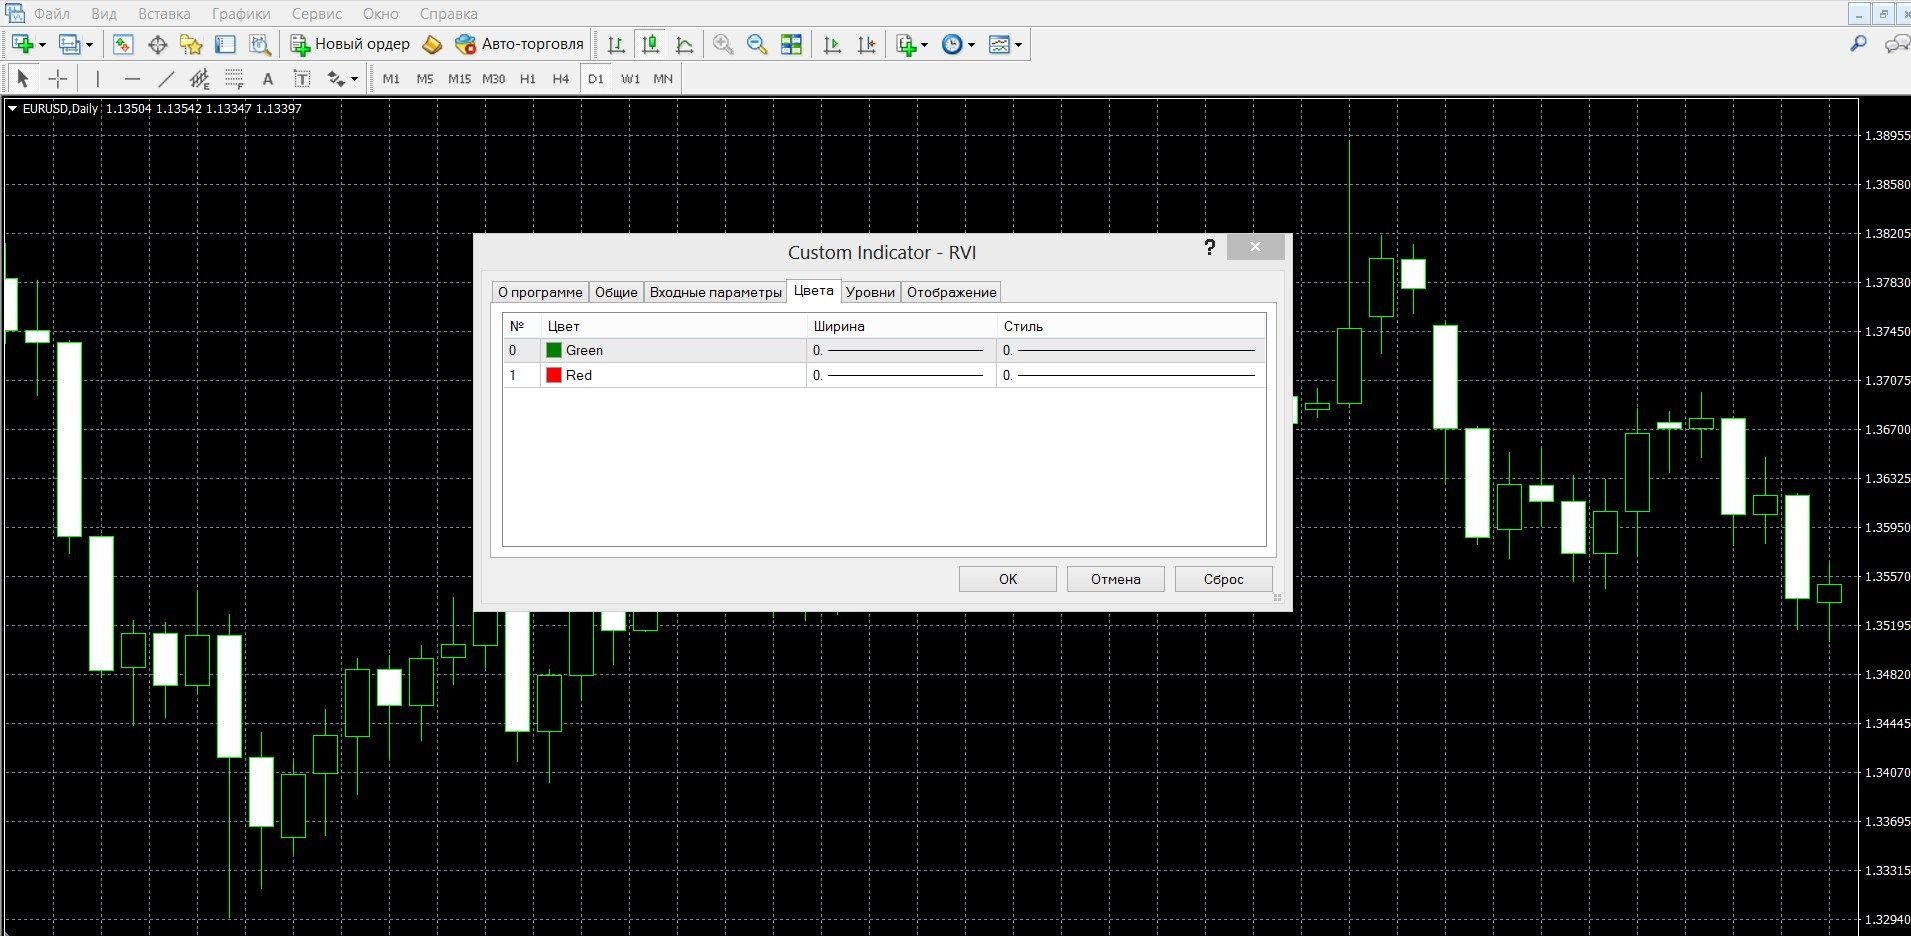
Indicator settings:
Unlike Stochastic, the instrument does not have extreme levels, it fluctuates at zero (as, for example, Momentum). The standard parameter recommended by the author of the tool is period 10, which gives a greater smoothness of the results, you can also change it according to your strategy.
Application of the indicator for binary options
RVI is an original but accurate tool that is popular with traders today. It is easy to use, visual and perfect for trading binary options, as well as in the Forex market. By opening and closing trades at price peaks, it will allow you to get the maximum income from the full trend. Following the trend gives a significant advantage of RVI – easy identification of market trends, following a rule that is understandable even for beginners:
- If the curves are rising, there is an upward trend in the market, it is worth buying call options,
- If the curves are decreasing, there is a downward trend in the market, it is worth buying put options.
Entering a trade at a minimum and exiting it at a market high, the indicator captures more effective price dynamics, being not only a valuable, but also a very profitable trading tool. It also shows high-quality signals of crossing lines, guaranteeing a good income. And yet, in order to reduce false signals, it is worth combining the tool with other indicators (for example, a moving average).
Like all oscillators, RVI, working perfectly within the price channel, gives a lot of erroneous signals during a flat, and with a strong unidirectional movement it is able to lose sensitivity.
Rules for concluding transactions (screenshots)
Trading with a trend signal
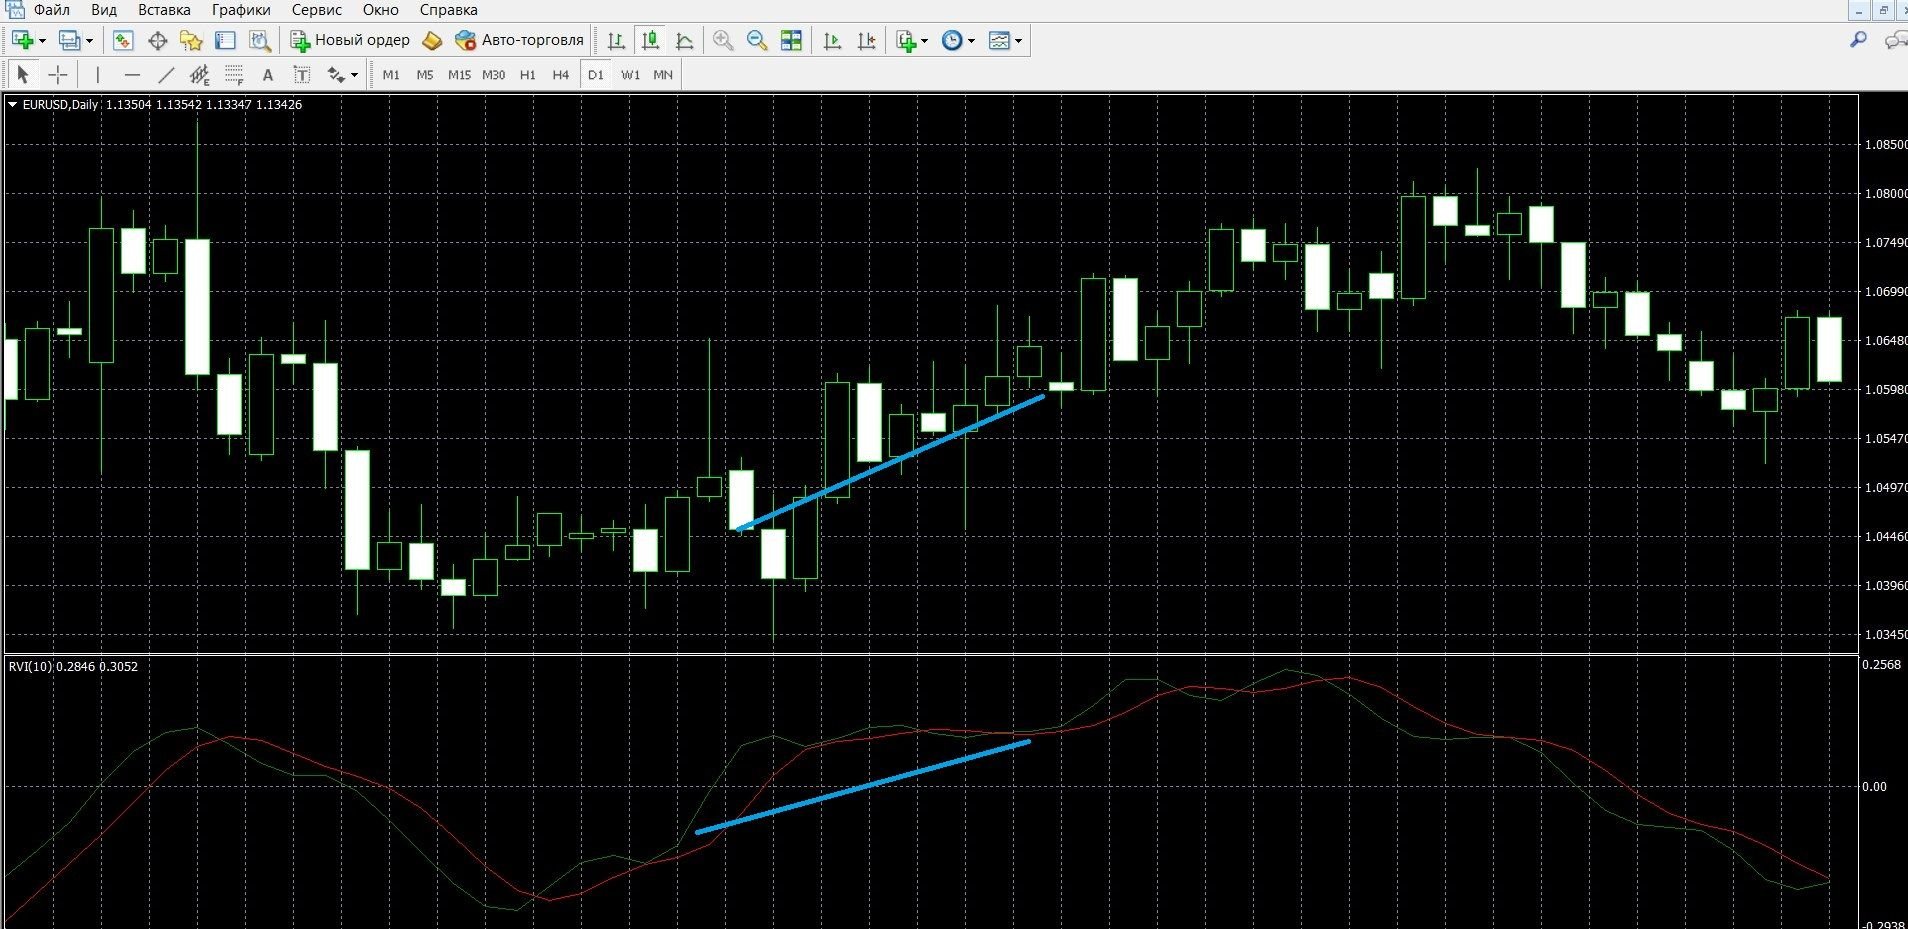
If both RVI curves are rising, this indicates an uptrend, it is recommended to buy call options. In the image you can see the uptrend in the MT4 terminal:
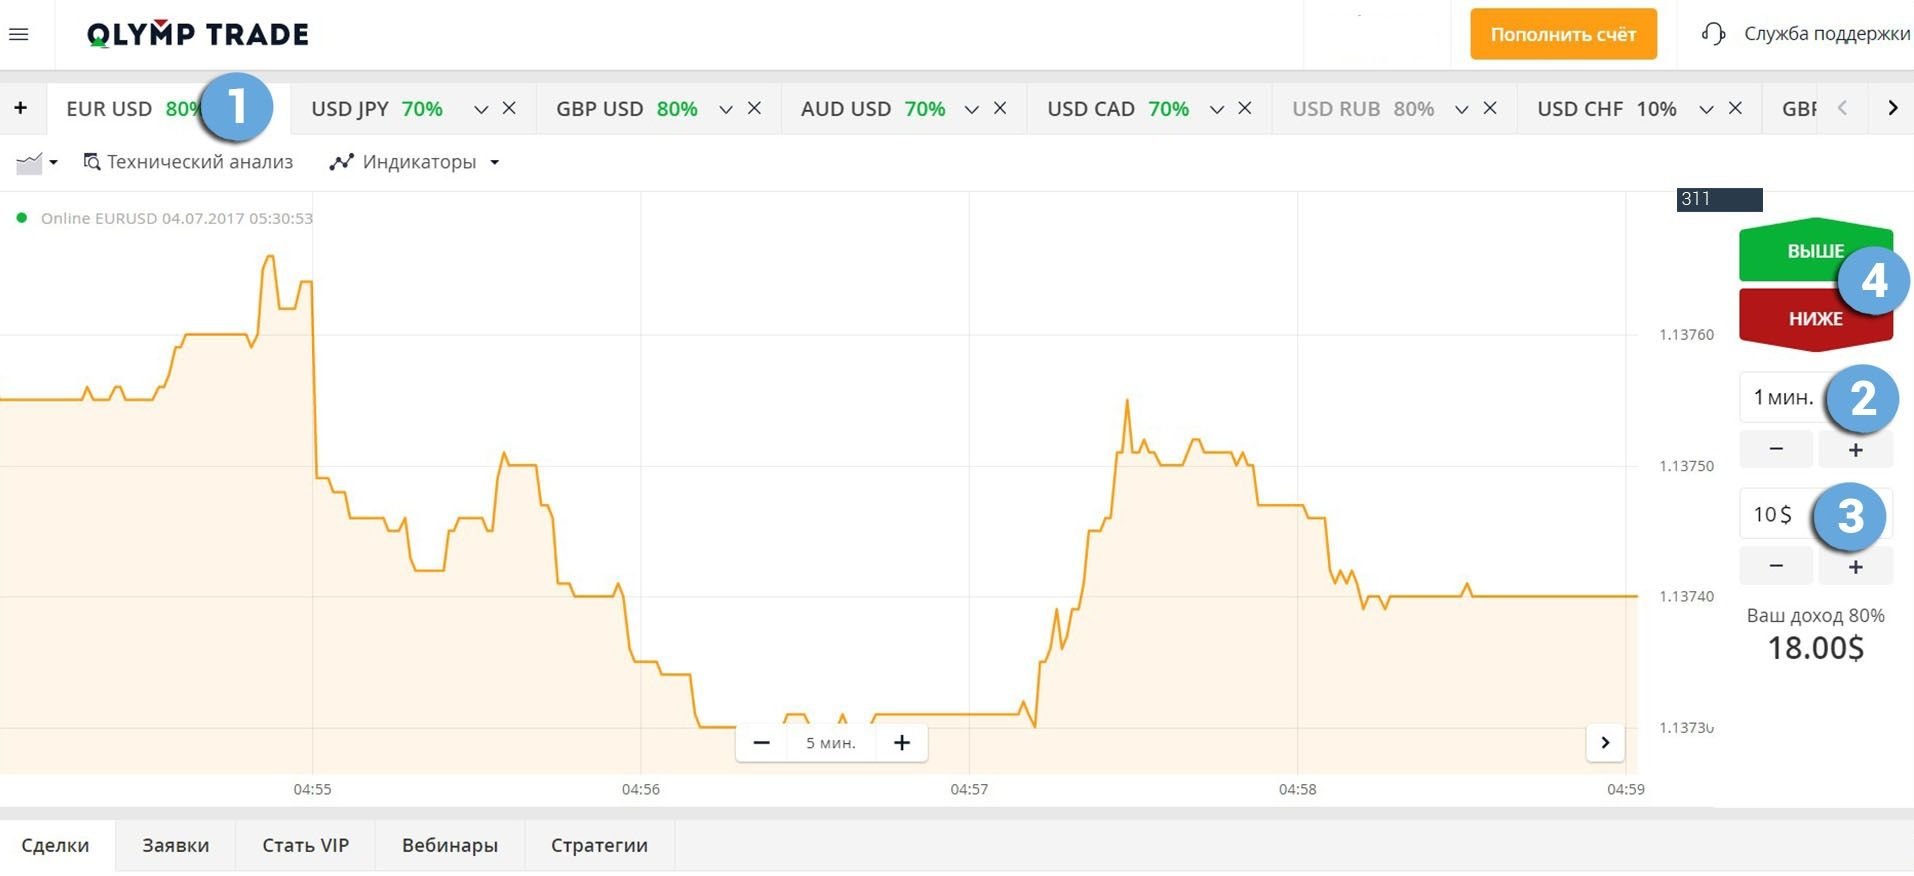
Take advantage of the trend and place a CALL bet with the Olymp Trade broker by going to the olymptrade.com website and preparing an option, indicating:
- Type of option
- Expiration date
- Amount
- Prediction: up
- Next, click the “buy” button and wait for the results of the forecast:
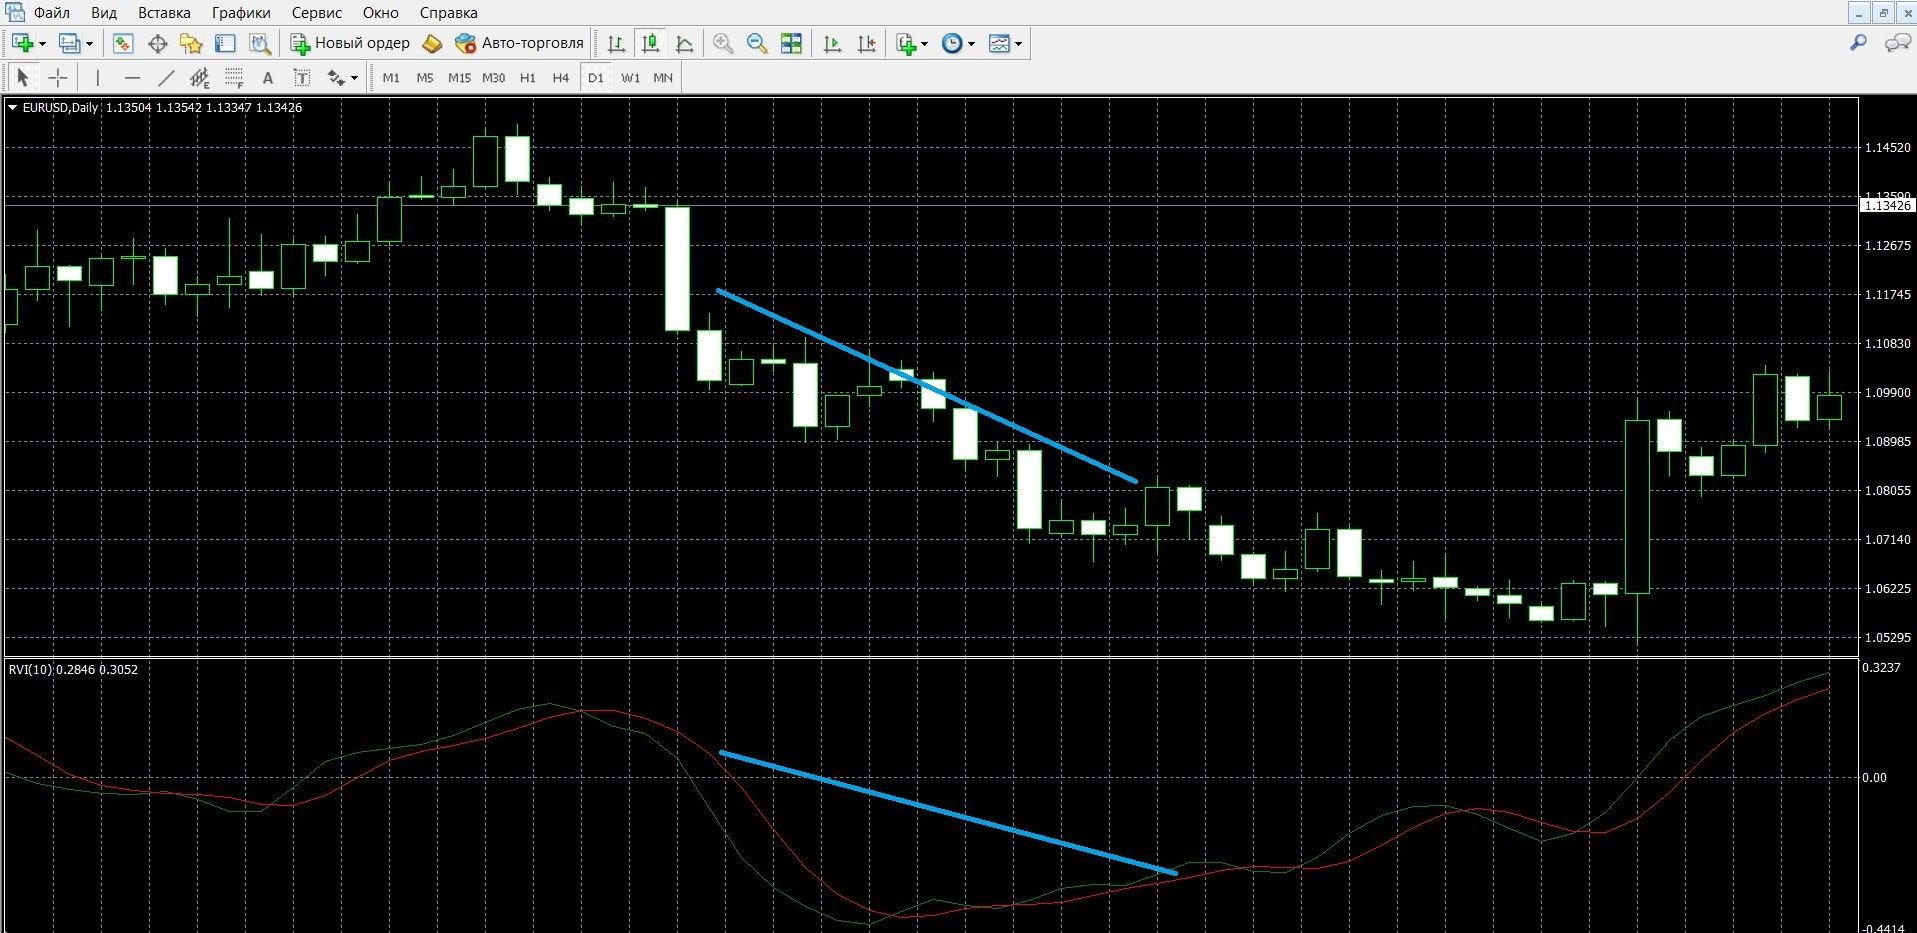
If the RVI curves are declining, we have a downtrend in front of us, it is recommended to buy put options. In the image, you can see the downtrend in the MT4 terminal:
Take advantage of the trend and place a PCI bet with the Olymp Trade broker by going to the olymptrade.com website and preparing an option, indicating:
- Type of option
- Expiration date
- Amount
- Prediction: down
- Next, click the “buy” button and wait for the results of the forecast:
Trading when the RVI line crosses
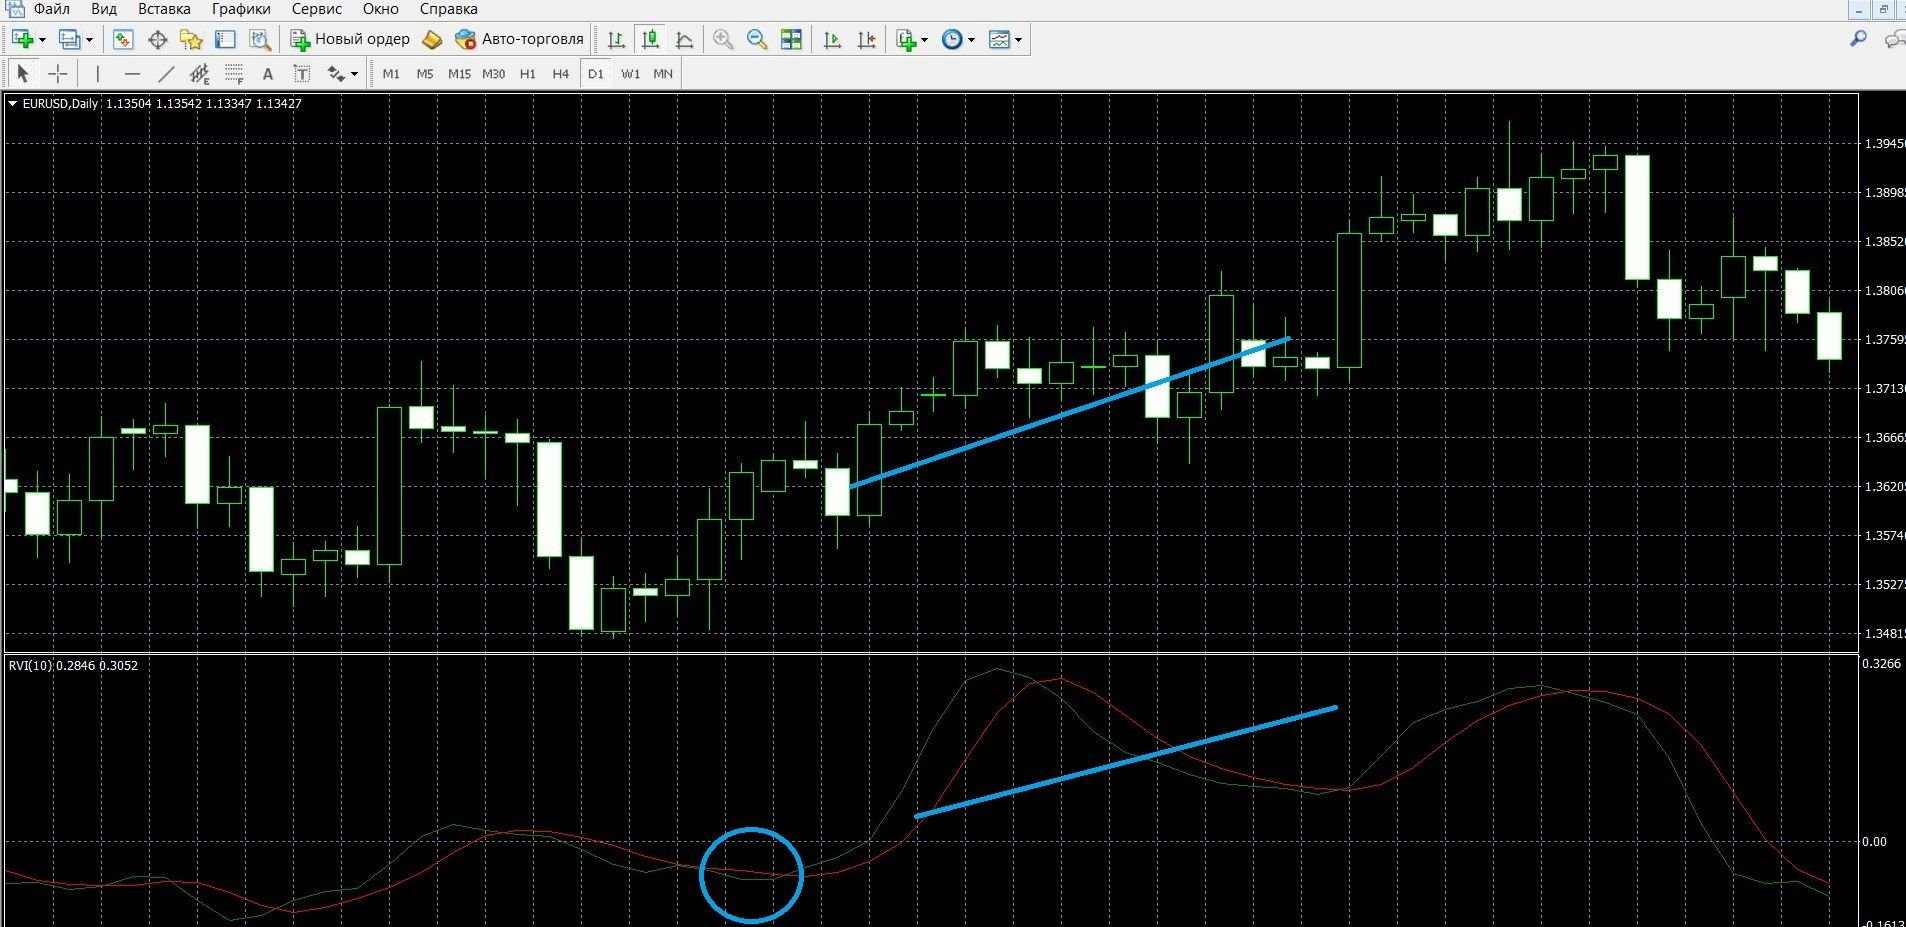
If the fast line (green) crossed the slow (red) in the bottom-up direction, this indicates that there is an uptrend on the stock exchange at the moment, it is worth buying call options. In the image, you can see the uptrend in the MT4 terminal (taking advantage of the trend, place a CALL bet on the olymptrade.com website, the instructions are listed above):
If the fast line (green) crossed the slow line (red) in the direction from top to bottom, this indicates that a downtrend is currently formed on the exchange, it is worth buying put options. In the image, you can see the downtrend in the MT4 terminal (taking advantage of the trend, place a PUT bet on the olymptrade.com website, the instructions are listed above):
Money management
Money management has always been considered a basic concept in trading, with the right work with which you can quickly and easily increase the efficiency of work in the market. If a trader is thinking about making a stable profit, this is easier to achieve by referring to the rules of money management, which will accurately adjust the management of deposit funds.
Minimum capital: when starting work in binary options, put the minimum amount of funds per transaction; the transaction value should not be more than 5% of the deposit; Purchase inexpensive options, and your transactions will not affect the state of the deposit. By implementing these rules of money management in your trading, you will save your capital perfectly.
Minimum deposit: starting work in binary options, participate in transactions that will allow you to spend the deposit economically; when buying a specific asset, do not transfer all your capital to it; Keep your account positive for as long as possible, given that your capital will still be useful to you. By implementing these rules of money management in your trading, you will be able to keep your deposit for a long time.
Minimum options: starting work in binary options, buy a minimum of options, for example, 2-3 assets; This rule applies more to beginners in trading, who, having become more confident and experienced, will be able to increase the number of assets. By implementing these rules of money management in your trading, you will be able to work most productively from the very first step in options.
Minimum of emotions: when starting work in binary options, always use only a serious working mood, because in the market you must use analytics and make informed decisions on which your productivity depends; It is worth remembering that in options it is not enough to rely only on experience, it is your attitude that makes your work effective. By implementing these rules of money management in your trading, you can easily make options trading a profession with the main income.
Expiration
Expiration is the moment when the trading of a particular asset has ended, and all participants in the transaction will know the result of their forecasts. This is also the basic concept of trading, which, like the basics of money management, will make your work on the stock exchange more successful.
Types of options:
- Ultra-short options – 30 seconds – 5 minutes.
- Short-term options – 10 minutes – several hours.
- Medium-term options – a day – a few weeks.
- Long-term options – a month – six months.
Is it allowed to extend the expiration?
It is allowed, but not in all trading terminals. If during trading you realize that an incorrect forecast is indicated, you just need to extend the expiration of the asset, which will reduce possible losses and make a profit.
Expiration rules:
- For beginners in the options market, it is better to initially trade long-term transactions that guarantee the stability of the result and a minimum of losses.
- It is better for experienced market players to work with expiration, which makes their trading and waiting for results more comfortable. Choose your broker carefully. Find out if it will be possible to extend the expiration period during trading, which will guarantee a reduction in losses.
- Those players who need instant income from the market should trade short-term trades that guarantee income in at least 30 seconds.
- Those players who need a stable profit from the market should trade long-term transactions that guarantee a good income.
Expiration in strategies with RVI
Expiration at a trend signal
Short-term trading: allowed; RVI works great by generating profitable signals of market trends, which will give, even with dynamic and risky express trading, high profits.
Medium-term expiration: allowed; RVI is an oscillator that accurately determines the profitable signals of the market trend, which will make your trading on the exchange effective; For greater efficiency, use additional tools.
Long-term expiration: allowed; RVI is an oscillator that accurately determines profitable trend signals, reliable strategies, fundamental and technical analysis will help you in a more accurate analysis, which will make your long-term trading much more effective.
Expiration at the signal of crossing the RVI lines
Short-term trading: allowed; both RVI lines work perfectly together, generating profitable trade entry signals, which will give, even with dynamic and risky express trading, high profits.
Medium-term expiration: allowed; Both lines of the oscillator work well together, accurately determining profitable signals to enter trades, which will make your trading on the exchange effective; For efficiency, use additional tools.
Long-term expiration: allowed; both RVI lines work well together, accurately identifying profitable signals, reliable strategies, fundamental and technical analysis will help you in a more accurate analysis, which will make your long-term trading much more effective.
Expiration in the “RVI+Alligator+MA” strategy
Short-term trading: allowed; A fairly effective strategy, the Alligator and MA indicators will signal the market trend, generating many profitable trend signals.
Medium-term expiration: allowed; Such a strategy will allow you to get the maximum income while trading; Indicators, working perfectly together, accurately identify profitable signals, allowing you to get good capital.
Long-term expiration: allowed; This effective strategy also works well in long-term trading, the indicators work well together, accurately identifying profitable signals; For more accurate analysis, you can also use reliable strategies, fundamental and technical analysis, which will make your long-term trading much more effective.
When getting acquainted with binary options trading, pay special attention to the concept of expiration, which will help you achieve success faster. Take advantage of the advanced features of the convenient terminal of the broker Olympus Trade, which offers a choice of expiration from 1 minute to 1 hour. By going to the broker’s website olymptrade.com now, you are approaching success faster.
Downloads
MetaTrader 4 (MT4) platform – download.
RVI indicator for the MT4 platform – download.