
Bollinger Band indicator
Description
One of the most popular ways to earn decent money through the Internet is to trade binary options. Trading is becoming more popular, offering more and more profitable opportunities for users: from express trading, which guarantees income in 30 seconds, to long-term options. The success of work in the market also depends on how well you know the features of the market and your capabilities, whether you use profitable strategies and new indicators in your work.
For the readers of our portal, we publish useful material, detailed reviews of oscillators, up-to-date ratings of market brokers and much more. By trying your first steps in trading with us, you increase your skill level, become more confident in trading and achieve new goals. In today’s review, we will talk about the Bollinger Bands and its possibilities for you.
Bollinger Bands, Bollinger Bands is one of the most common and effective trend technical indicators that allows you to accurately measure market volatility and find high-quality trend signals. For the first time, the features and theory of the instrument were described by Perry Kaufman in 1987 in the book “New Methods and Systems of the Game in the Commodity Market”. Then, on the basis of these materials, as well as thanks to the works of the American analyst John Bollinger, the tool was developed and presented to the public.
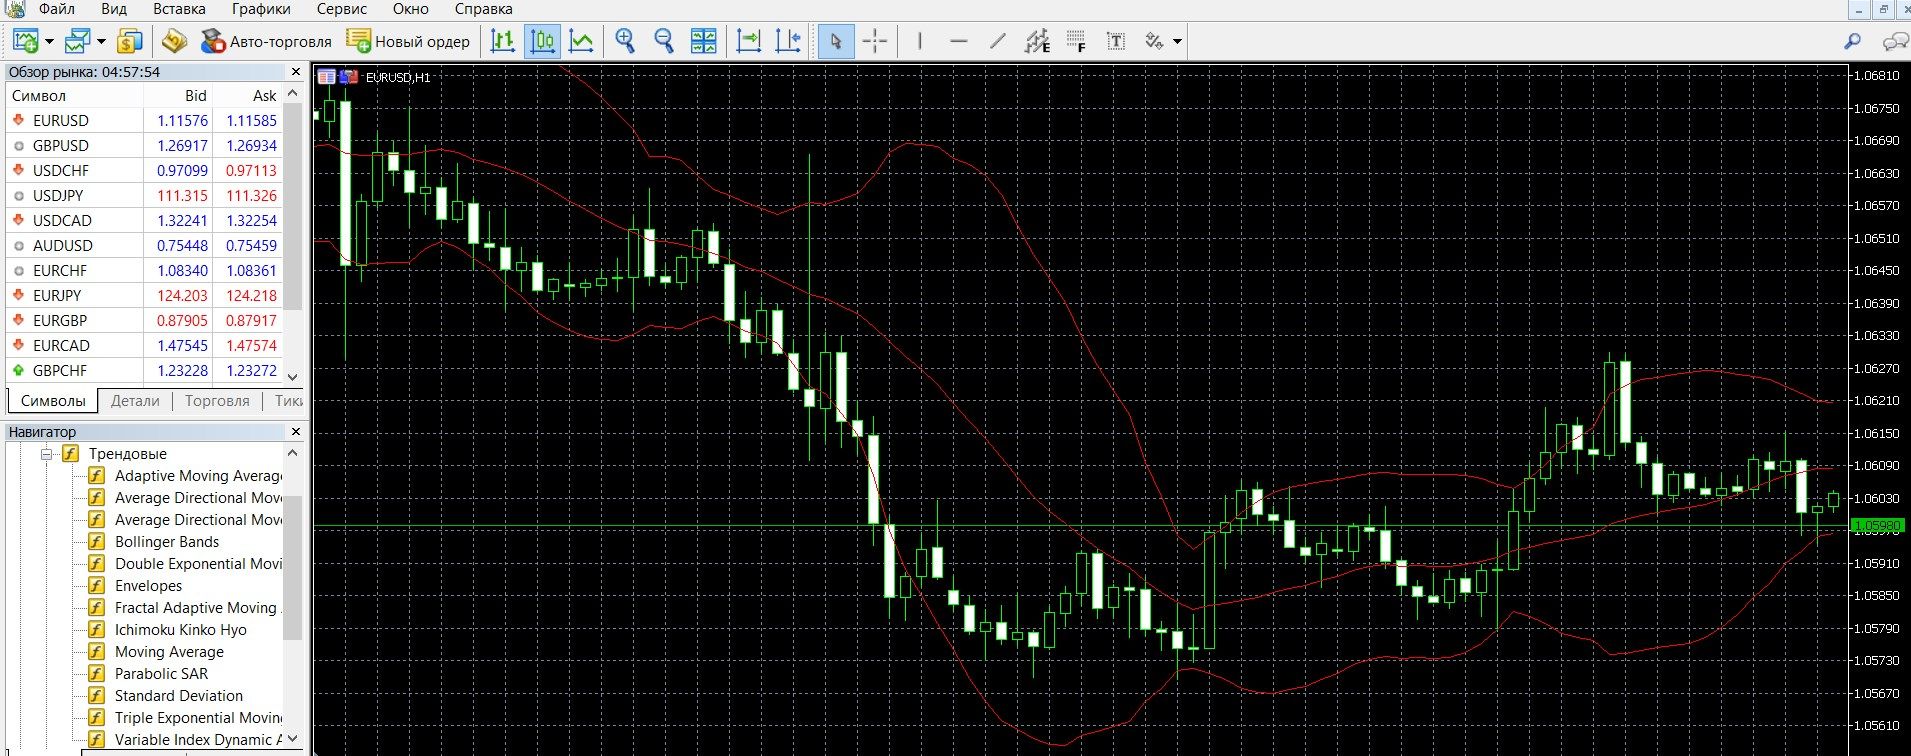
Graphically, Bollinger Bands are lines that limit the movement of the price chart within the band; These are support and resistance levels. The uniqueness of the indicator is that its width depends on the state of the market. For example, with high volatility, during the release of the main news, the band expands greatly, demonstrating instability.
You can see what the Bollinger Bands look like on the MetaTrader 4 (MT4) platform in the image below. You can also download the MetaTrader 4 platform and get acquainted with the oscillator in practice.
How does the Bollinger Bands indicator work?
Bollinger Bands are similar to Envelopes , the difference is that the limits of the Envelopes are above and below the sliding curve at a fixed distance, and the Bollinger Bands are built at distances that are equal to a specific number of deviations. Here, the deviation rate depends on the level of volatility, Bollinger Bands adjust their width, which increases (in case of market volatility) and decreases (when it is stable).
The basis of the instrument is a gray corridor, as well as three moving averages, which provide important information about the state of the market:
- The central band is a simple moving average (SMA for 20 days),
- The upper band is a moving average + 2 standard deviations,
- The lower band is a moving average – 2 standard deviations.
Most of the indicator signals pass within these bands, these signals can be used to predict the market situation.
Features of working with Bollinger Bands:
- After the volatility decreases, there is a sharp change in the price trend;
- When the price has gone beyond the band, expect the trend to continue;
- Price dynamics, starting from one border, most often reach the opposite border.
The formula for calculating Bollinger Bands is:
The middle line (MIDDLE LINE, ML) is a regular moving average.
ML = SUM (CLOSE, N) / N = SMA (CLOSE, N)
The upper line (TOP LINE, TL) is the same middle line shifted upwards by a certain number of standard deviations (D).
TL = ML + (D * StdDev)
The BOTTOM LINE (BL) is the middle line shifted down by the same number of standard deviations.
BL = ML – (D * StdDev), where:
SUM (…, N) — sum for N periods;
CLOSE — closing price;
N is the number of periods used for calculation;
SMA is a simple moving average;
SQRT is the square root;
StdDev standard deviation:
StdDev = SQRT (SUM ((CLOSE — SMA (CLOSE, N))^2, N)/N)
Info taken from www.metatrader5.com website
Bollinger Bands indicator signals:
Price breakout signals:
- If prices touch and break through the upper limit, the trend is upward, we should expect it to fall further, so you can buy a PCI option (down),
- If prices have broken through the lower limit, the trend is downward, we should expect further growth, so you can buy a CALL option (up).
Reversal signals:
In this situation, a good confirmation of the trend will be the change of pin bars.
- If the reversal comes from the upper line of the Bands (the pin bars have changed from green to red), you can buy a PAT option (down),
- If the reversal comes from the lower line of the Bands (the pin bars have changed from red to green), you can buy a CALL option (up).
Signals in case of market flat:
The market is dynamic, it is constantly moving from the trend phase to the stagnation phase. The bands become wider when market volatility rises, and narrower when it falls:
- When the price falls from a very narrow Bollinger range, you can buy a put option (down),
- When the price rises from the narrow Bollinger range, you can buy a CALL option (up).
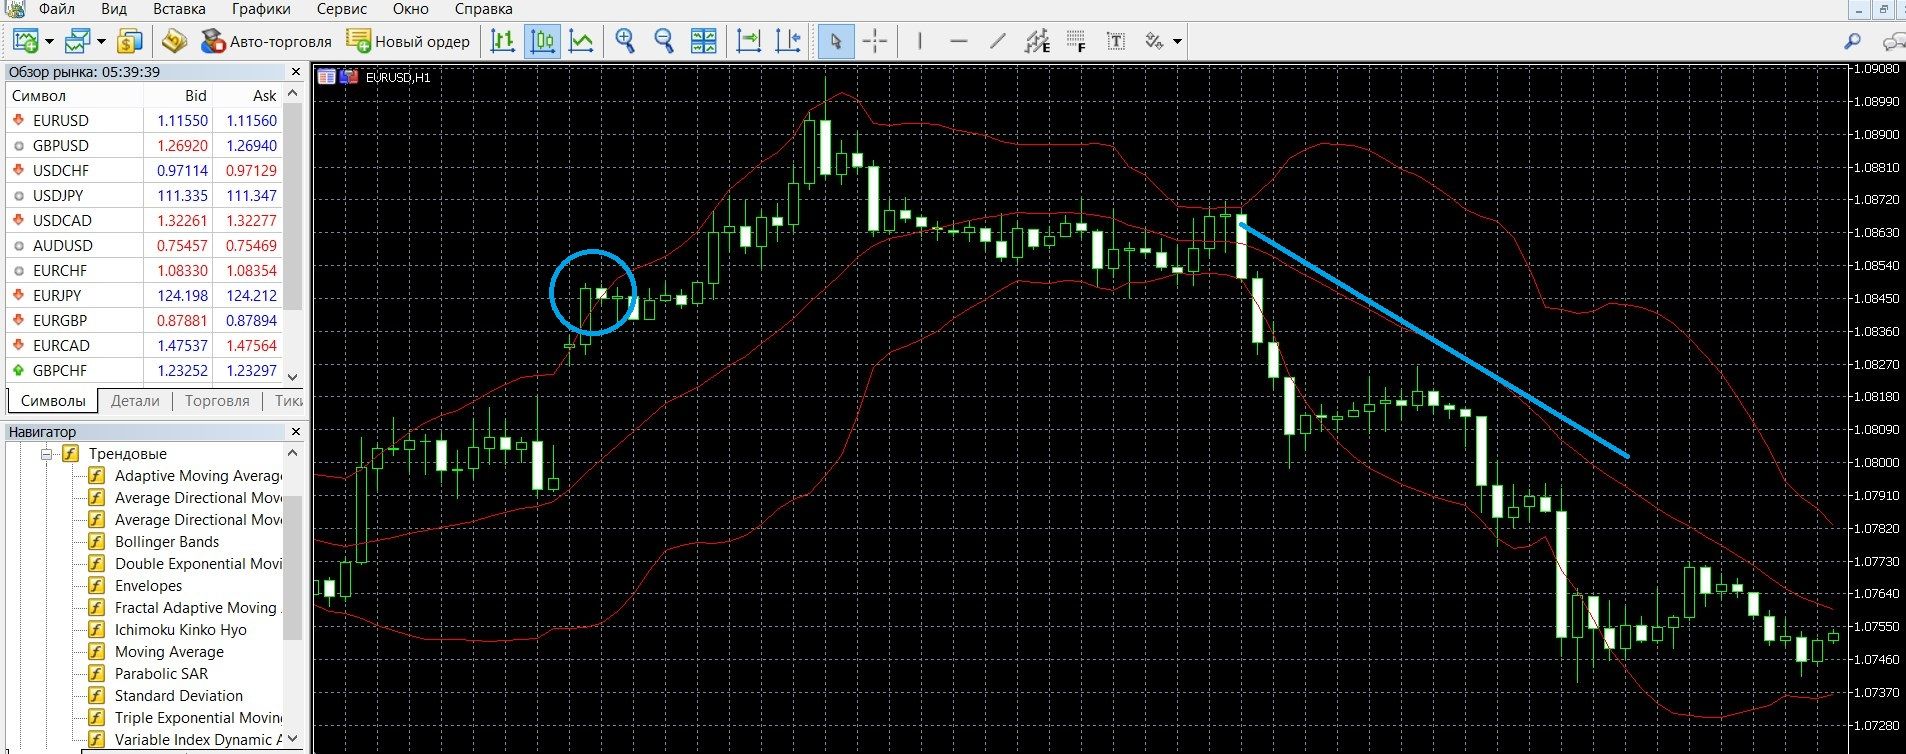
This is where the most reliable market movements begin, and the transition from a calm to an active market can be clearly defined. The longer the price is in a narrow corridor, the stronger the trend will be.
Signals by figures:
In trading, it is popular to search for signals by reversal patterns:
- model M (strong signal of a downtrend), you can buy a PUT option (down),
An M-signal is generated when:
- The price has touched or broken through the upper line of the Bands,
- Then the price moves to the middle line,
- Further, the price forms the second peak, located below the first peak, and breaks through the middle band.
- model W (strong signal of an uptrend), you can buy a CALL option (up).
A W signal is generated when:
- The price has touched or broken through the lower line of the Bands,
- Then the price moves to the middle line,
- Further, the price forms the second bottom, which is above the first one and breaks through the middle line of the Bands.
Do I need to install the indicator in your platform?
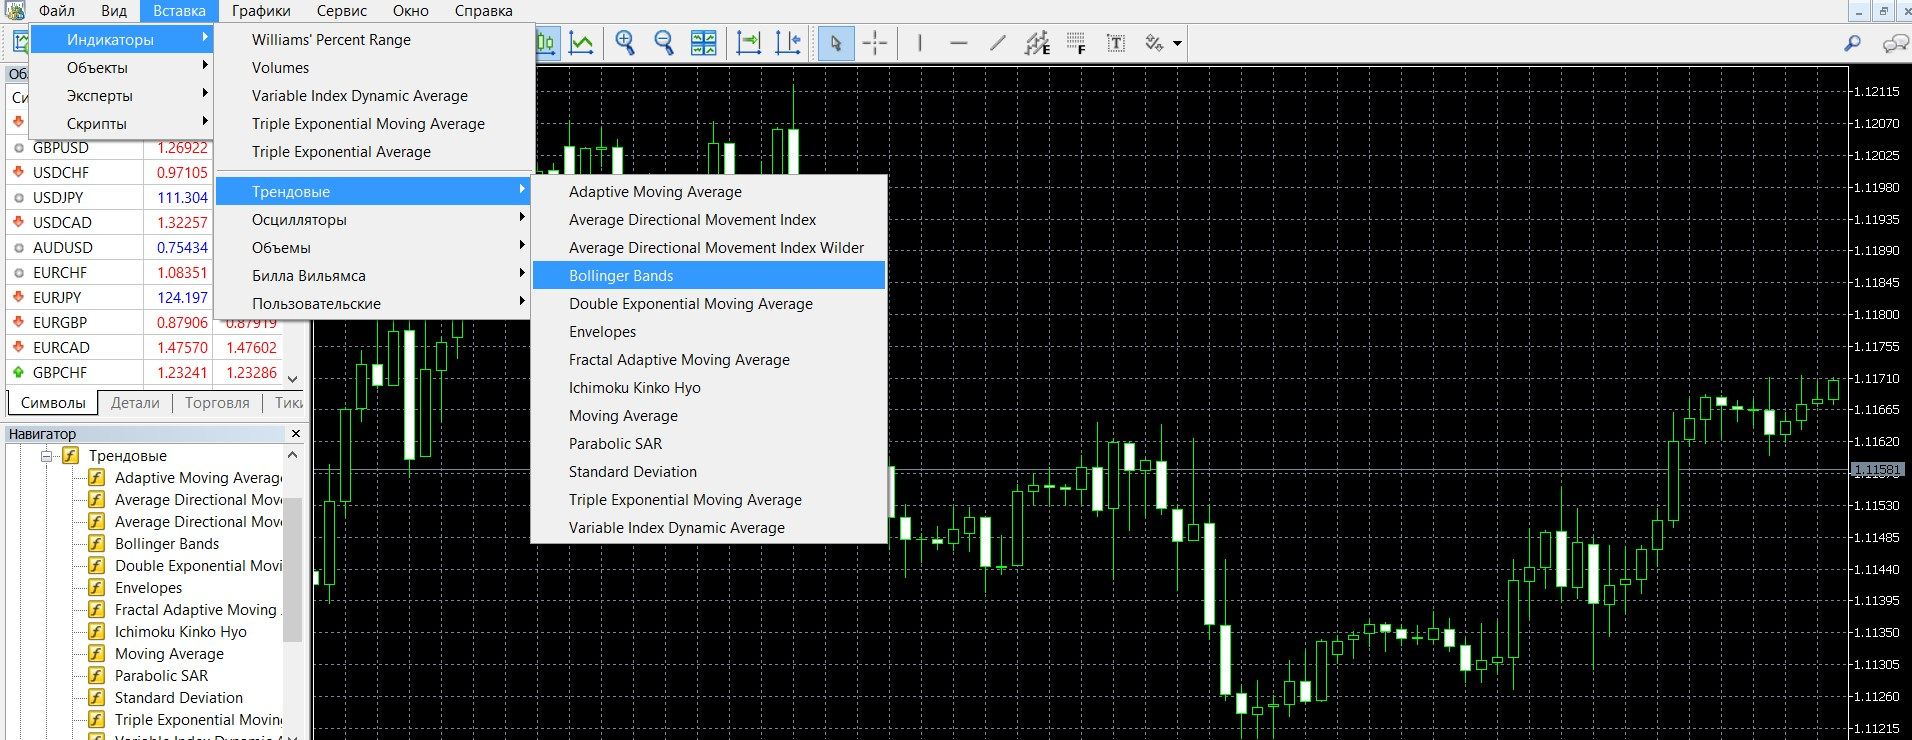
Bollinger Bands is a standard technical analysis tool that is part of modern terminals, including MetaTrader 4. To add an oscillator to a price chart, do the following:
- Click the “Insert” tab in the top menu of the platform
- Select the tab “Indicators” – “Trending”
- In the drop-down menu that opens, select “Bollinger Bands”.
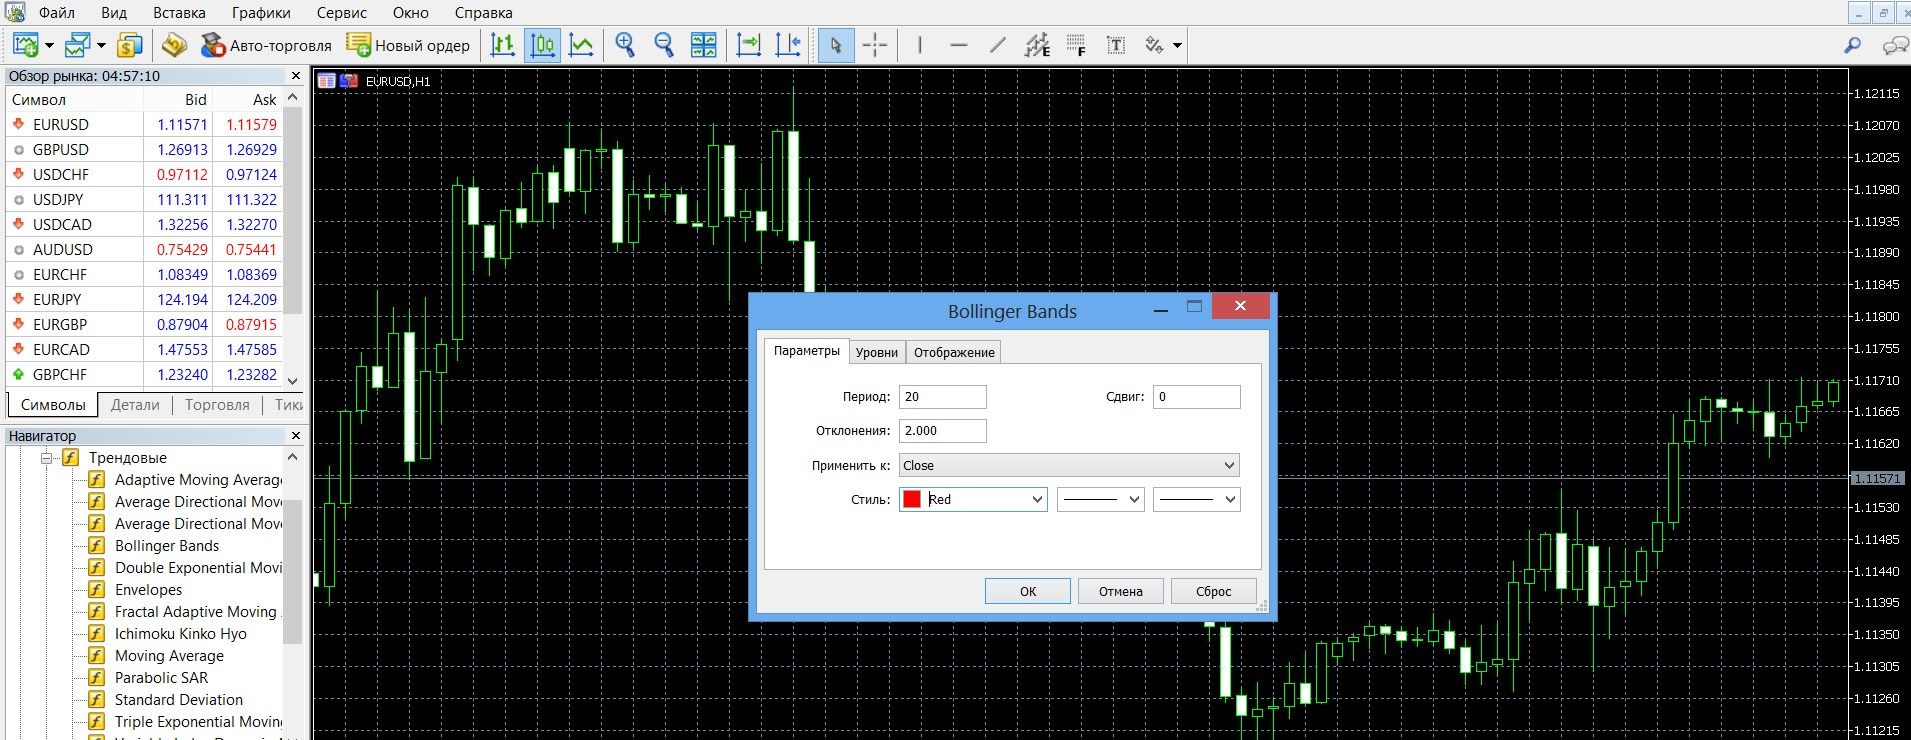
It is recommended to use the standard settings of the tool, as the author of the tool advises traders, but you can change them based on your strategy.
The main settings of Bands that change its behavior:
Periods have a standard value of 20 periods (candles). If you reduce the period indicator to less than 20, the indicator will react faster to market dynamics, but in this case, the number of false signals increases. By specifying the value of the 20 mark, you will reduce false signals, but you may not notice some of the quality ones.
The standard deviation has a base value of 2. This indicator determines the distance between the bands and the center line. If you increase this indicator, the distance from the bands to the center line will increase, most of the maneuvers will take place inside, there will be fewer breakthroughs. If you reduce it, the distance between the bands and the center line will decrease, there will be more breakthroughs.
If your platform doesn’t have an indicator, download it here.
Application of the indicator for binary options
Bollinger Bands display the value of an asset based on market volatility or volatility. This is one of the most popular and effective tools for a trader, it is included in many profitable strategies. In binary options trading, Bollinger Bands are more often used for:
- determining the channel inside which the price is located,
- definitions and warnings about trend dynamics,
- indications of the state of the flat (movement in the horizontal corridor),
- finding support and resistance levels,
- warnings about the upcoming change in volatility,
- accurately determine the highs and lows of the market.
The indicator has only one drawback – data lag, therefore, when working with it, it is recommended to use additional oscillators to confirm signals, for example, Stochastic, RSI, ADX, MACD , etc.
Bollinger Bands are so common for a reason, in the hands of a professional it is an authoritative and reliable tool. The indicator works better on 5- and 15-minute timeframes, you can use it in turbo trading as well, but be careful here.
Rules for concluding transactions (screenshots)
Trading with a price breakout signal
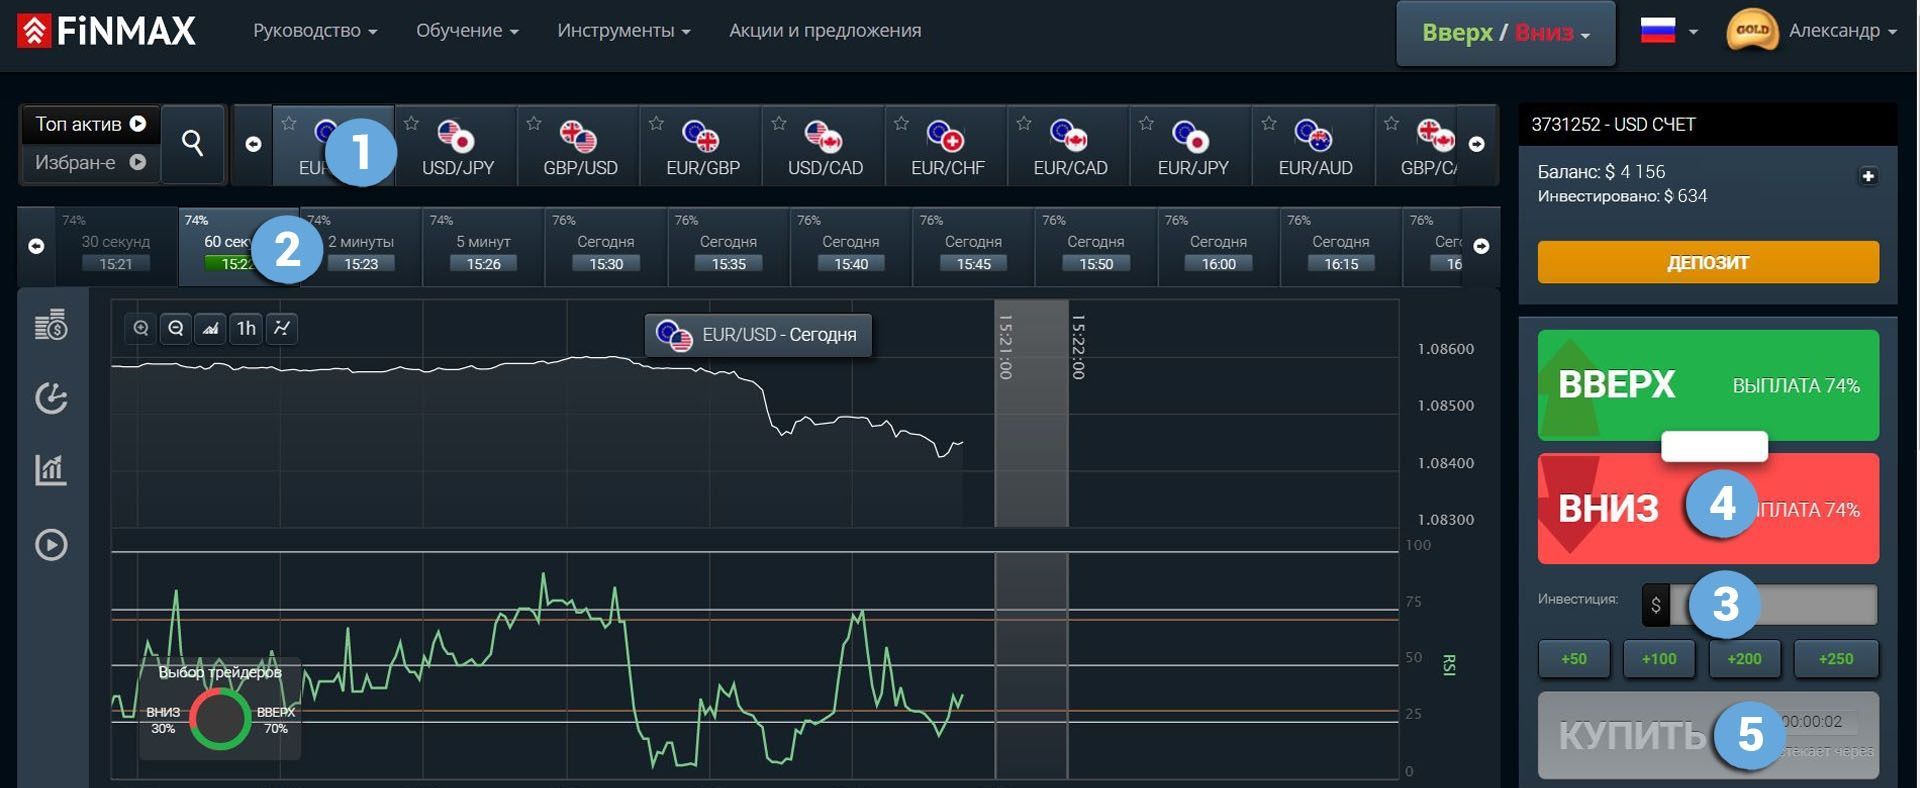
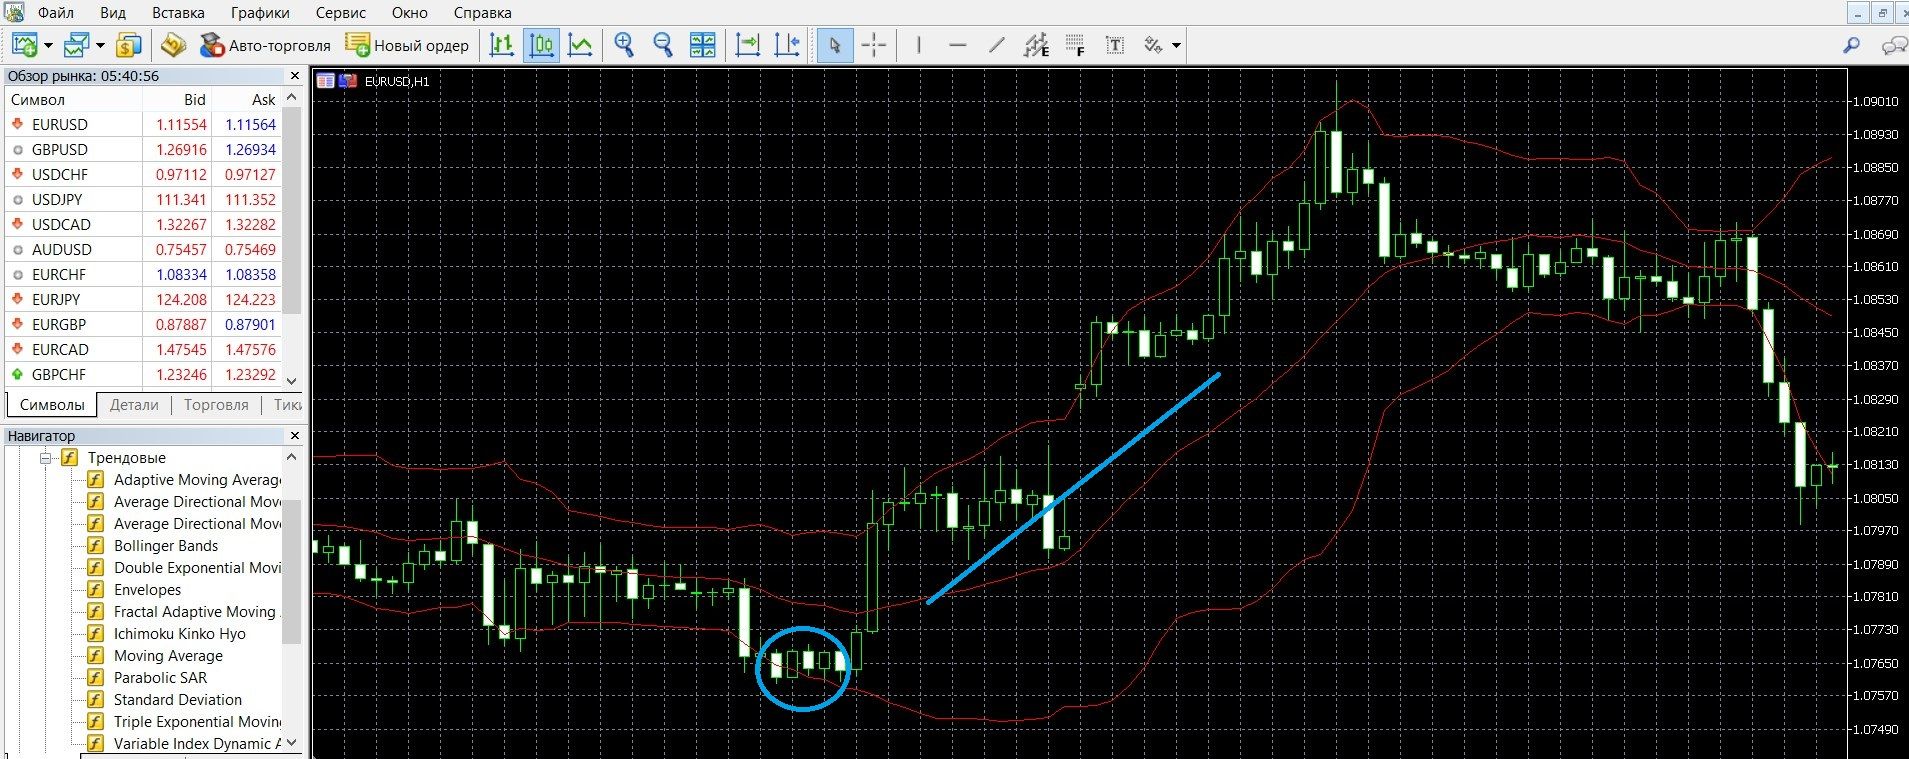
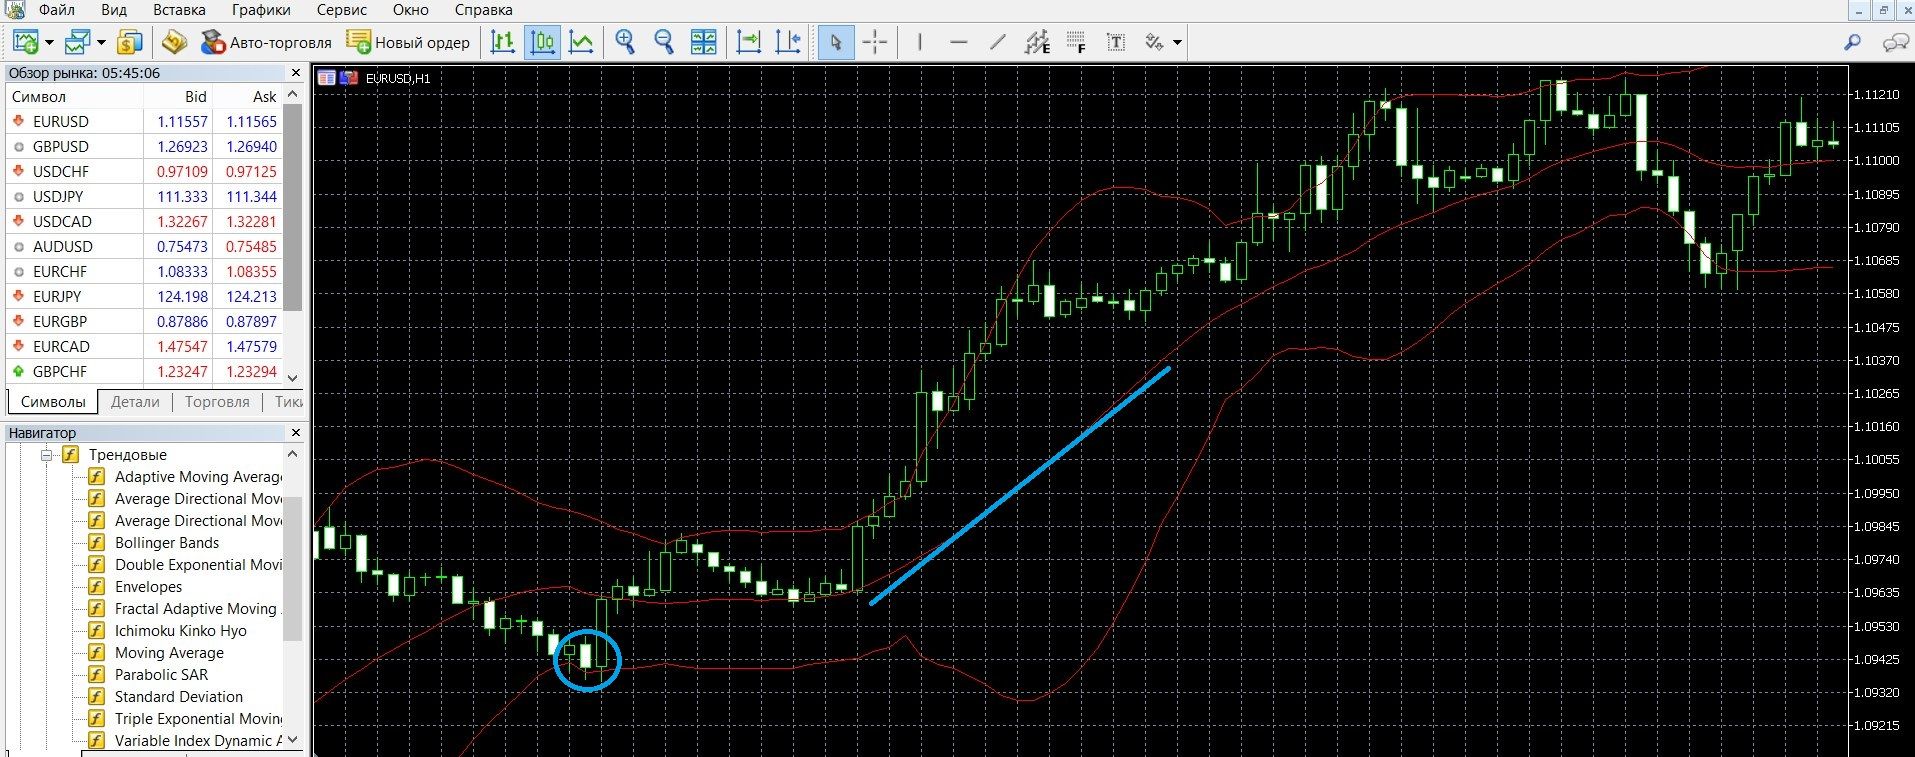
- If prices touch and break through the upper limit of the Bollinger Bands, the trend is upward, we should expect it to fall further, so you can buy a put option (down). The image below shows the downward trend of the market (which arose when the price breakout was signaled) on the MetaTrader 4 platform:
Using the approaching downtrend, you can place a PUT bet with the Finmax broker. Go to the finmaxbo.com broker’s website and prepare the option for the transaction, indicating:
- Option
- Expiration
- Amount
- Prediction: down
- Click the “buy” button and wait for the results:
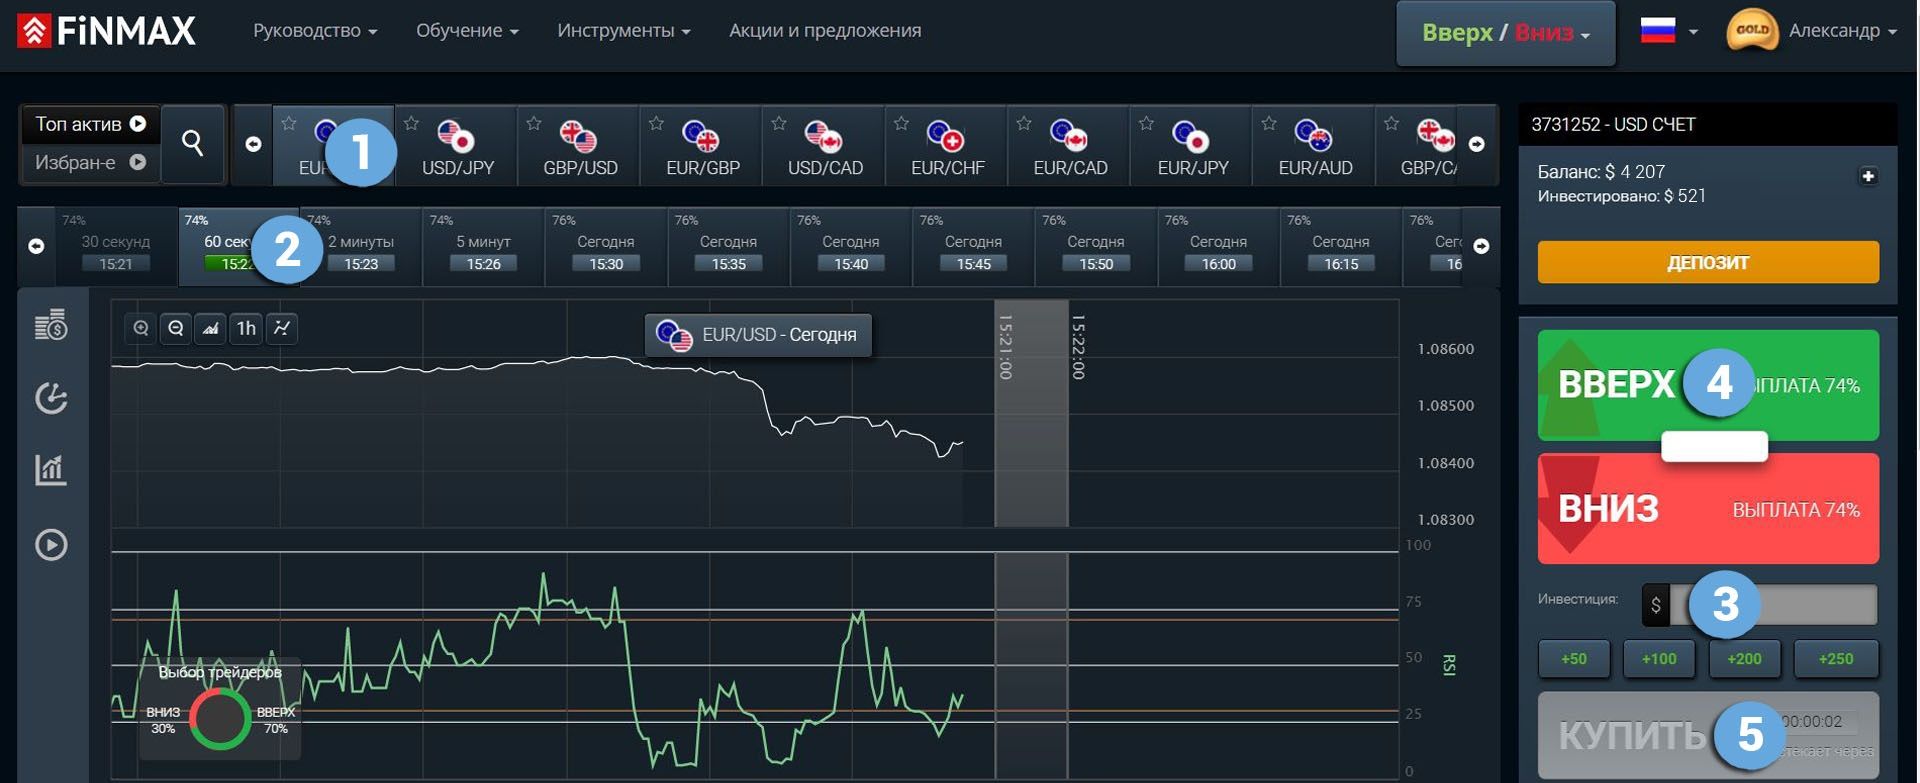
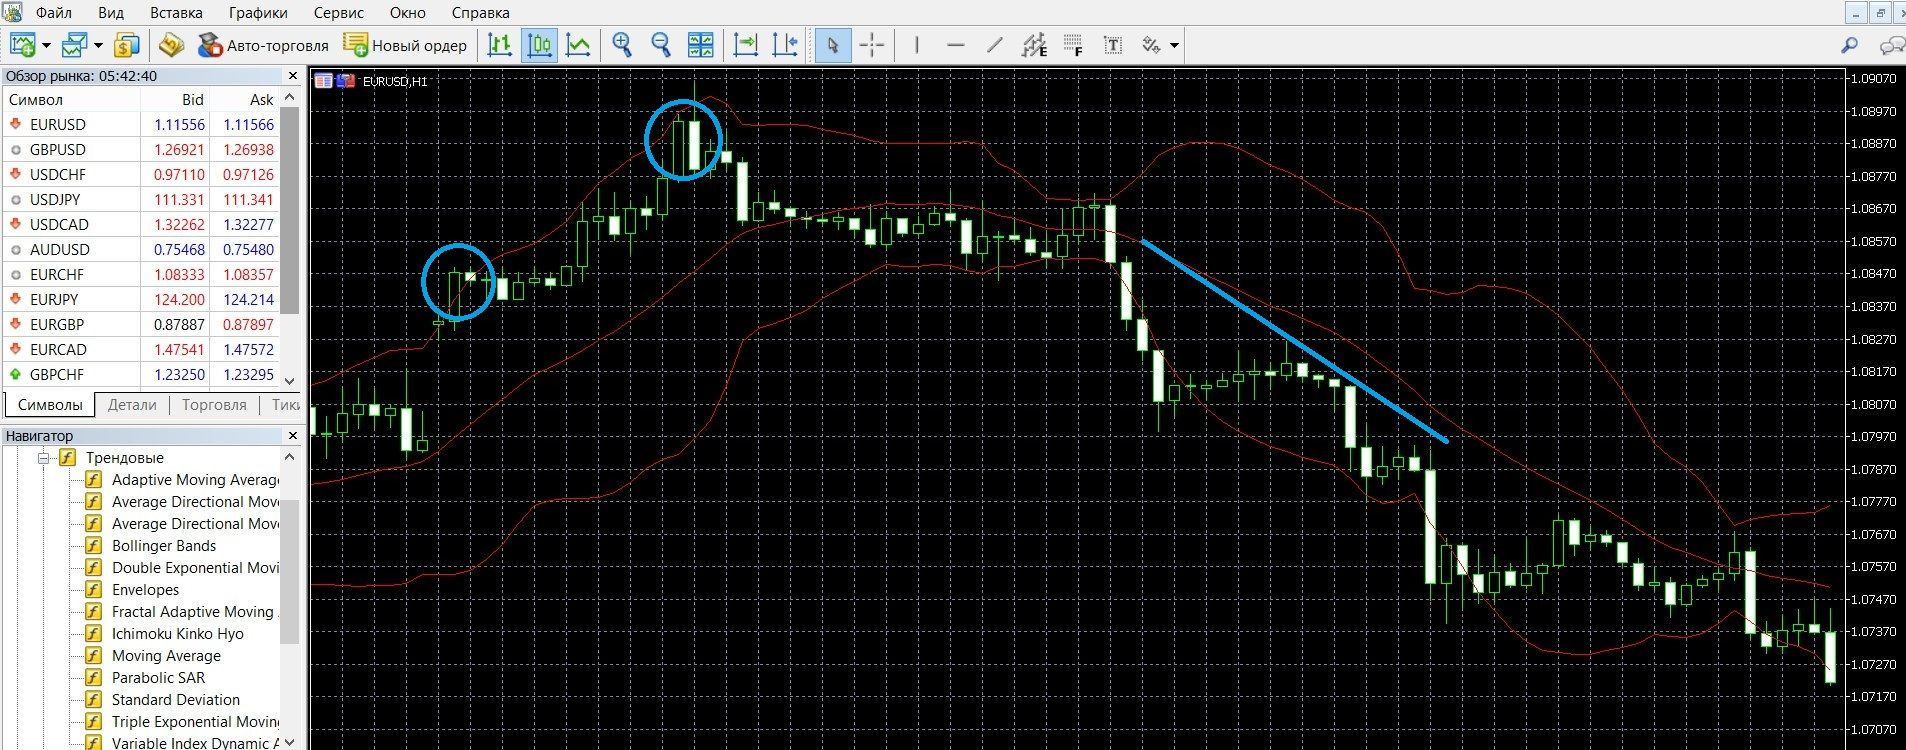
- If prices have broken through the lower limit, the trend is downward, we should expect further growth, so you can buy a CALL option (up). The image below shows the upward trend of the market (which arose when the price breakout signal) on the MetaTrader 4 platform:
Using the approaching uptrend, you can place a CALL bet with the Finmax broker. Go to the finmaxbo.com broker’s website and prepare the option for the transaction, indicating:
- Option
- Expiration
- Amount
- Prediction: up
- Click the “buy” button and wait for the results:
Trading on a reversal signal
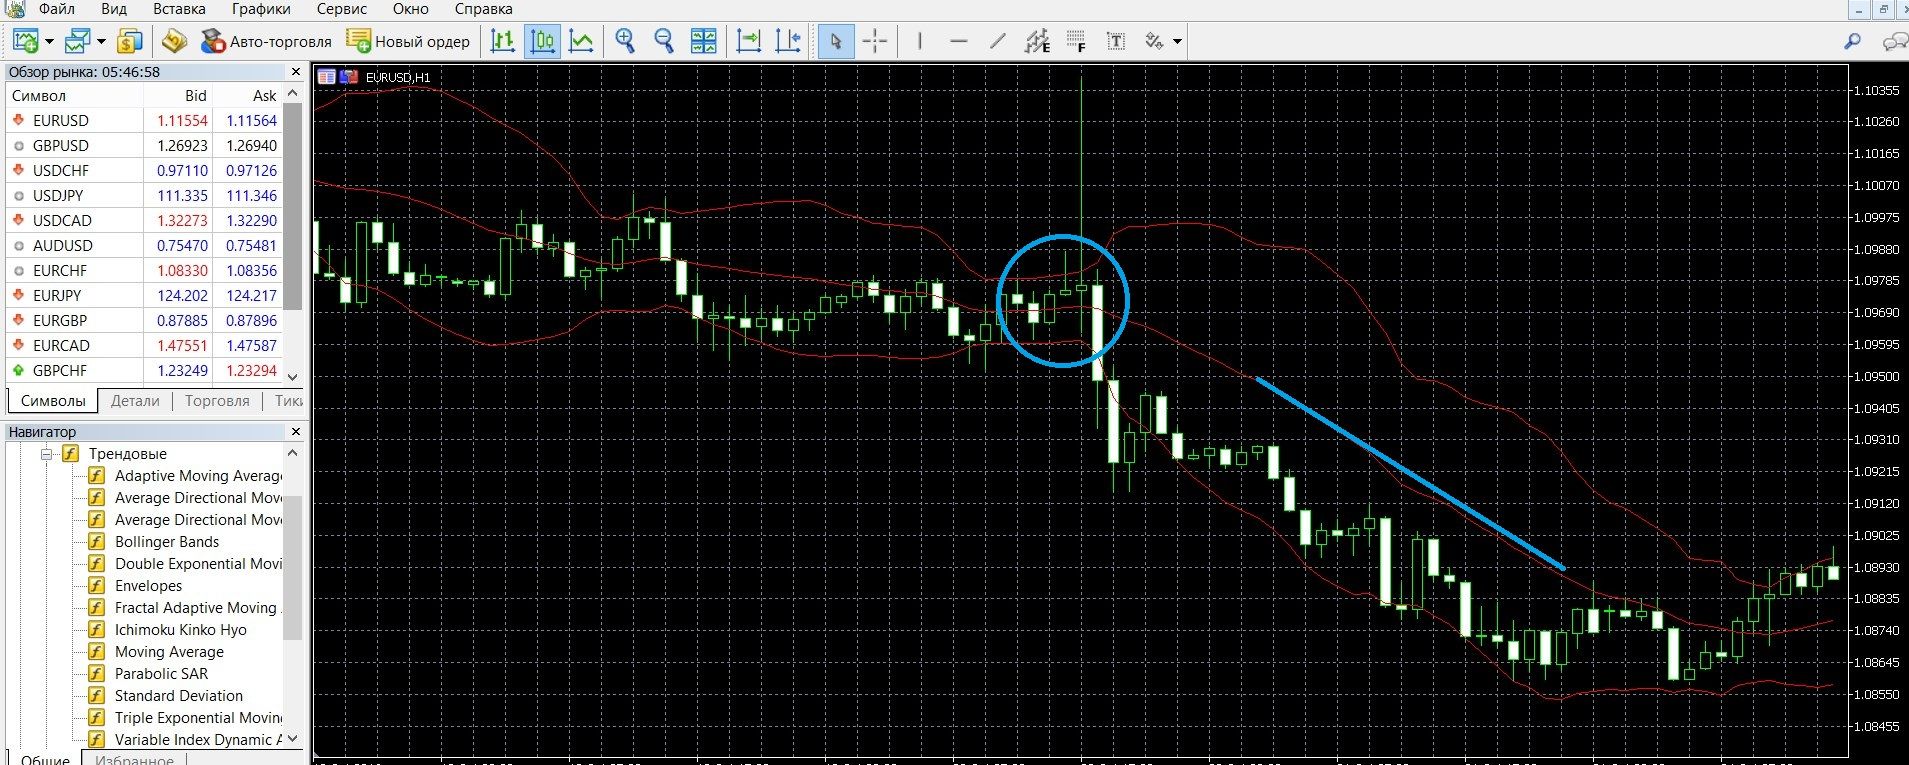
- If the reversal comes from the upper line of the Bands (the pin bars have changed from green to red), you can buy a put option (down). In the image below, you can see the downtrend on the MetaTrader 4 platform (make money on the PCI rate on the finmaxbo.com broker’s website, the instructions are listed above):
- If the reversal comes from the lower line of the Bands (the pin bars have changed from red to green), you can buy a CALL option (up). In the image below, you can see an uptrend on the MetaTrader 4 platform (make money on the CALL rate on the finmaxbo.com broker’s website, the instructions are listed above):
Trading when the market is flat
- When the price falls from a very narrow Bollinger range, it is possible to buy a PUT option (down). In the image below, you can see the downtrend on the MetaTrader 4 platform (make money on the PCI rate on the finmaxbo.com broker’s website, the instructions are listed above):
- When the price rises from the narrow Bollinger range, you can buy a CALL option (up). In the image below, you can see an uptrend on the MetaTrader 4 platform (make money on the CALL rate on the finmaxbo.com broker’s website, the instructions are listed above):
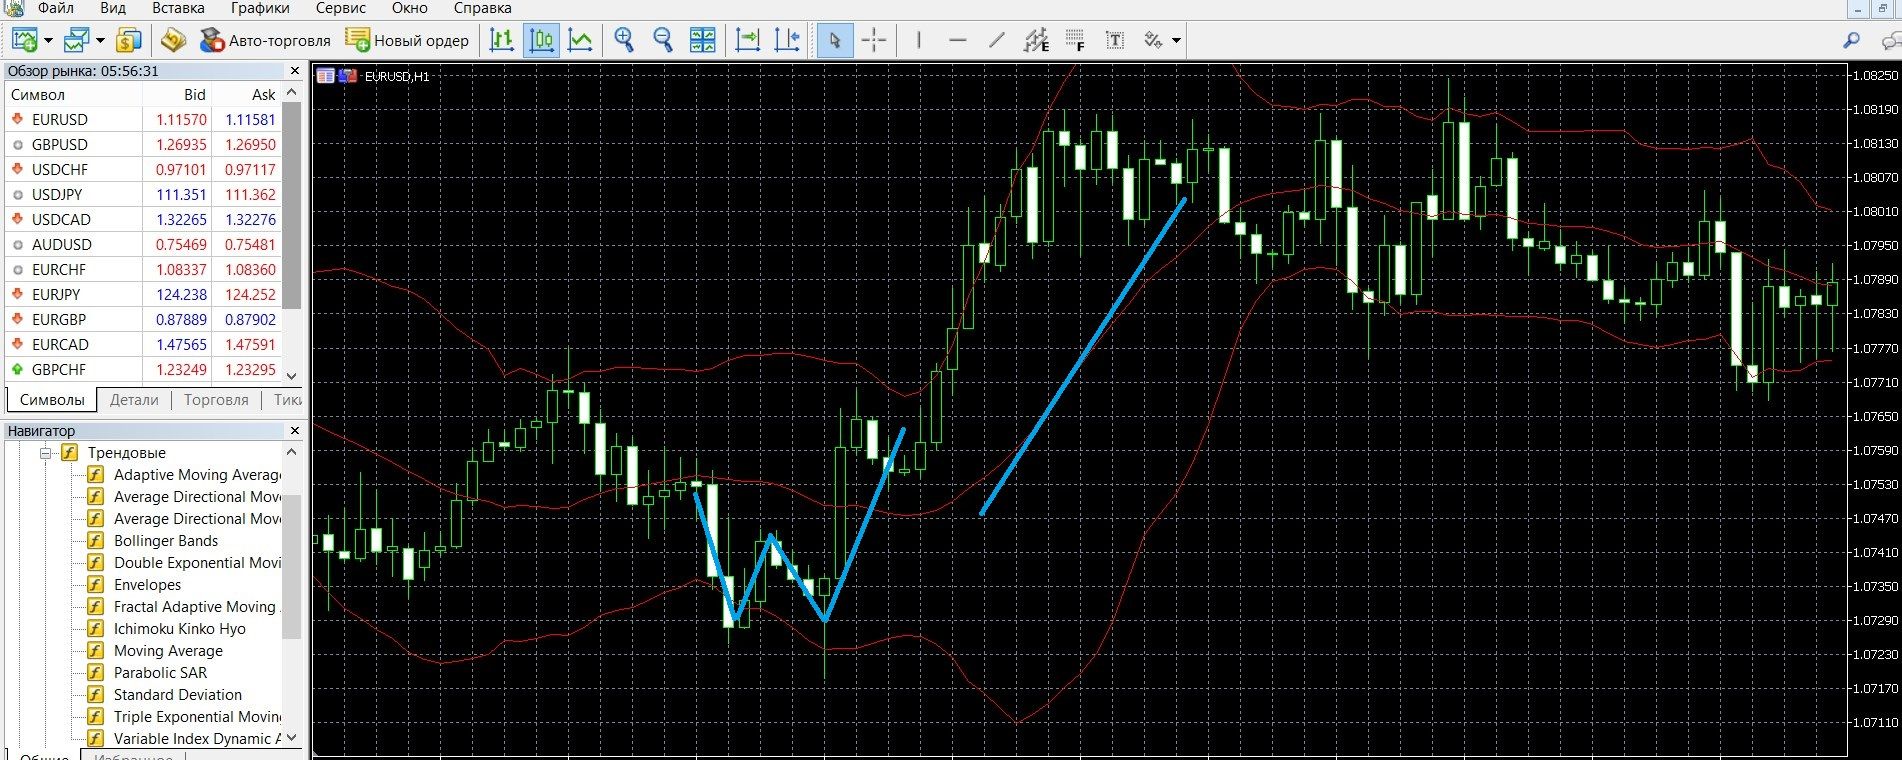
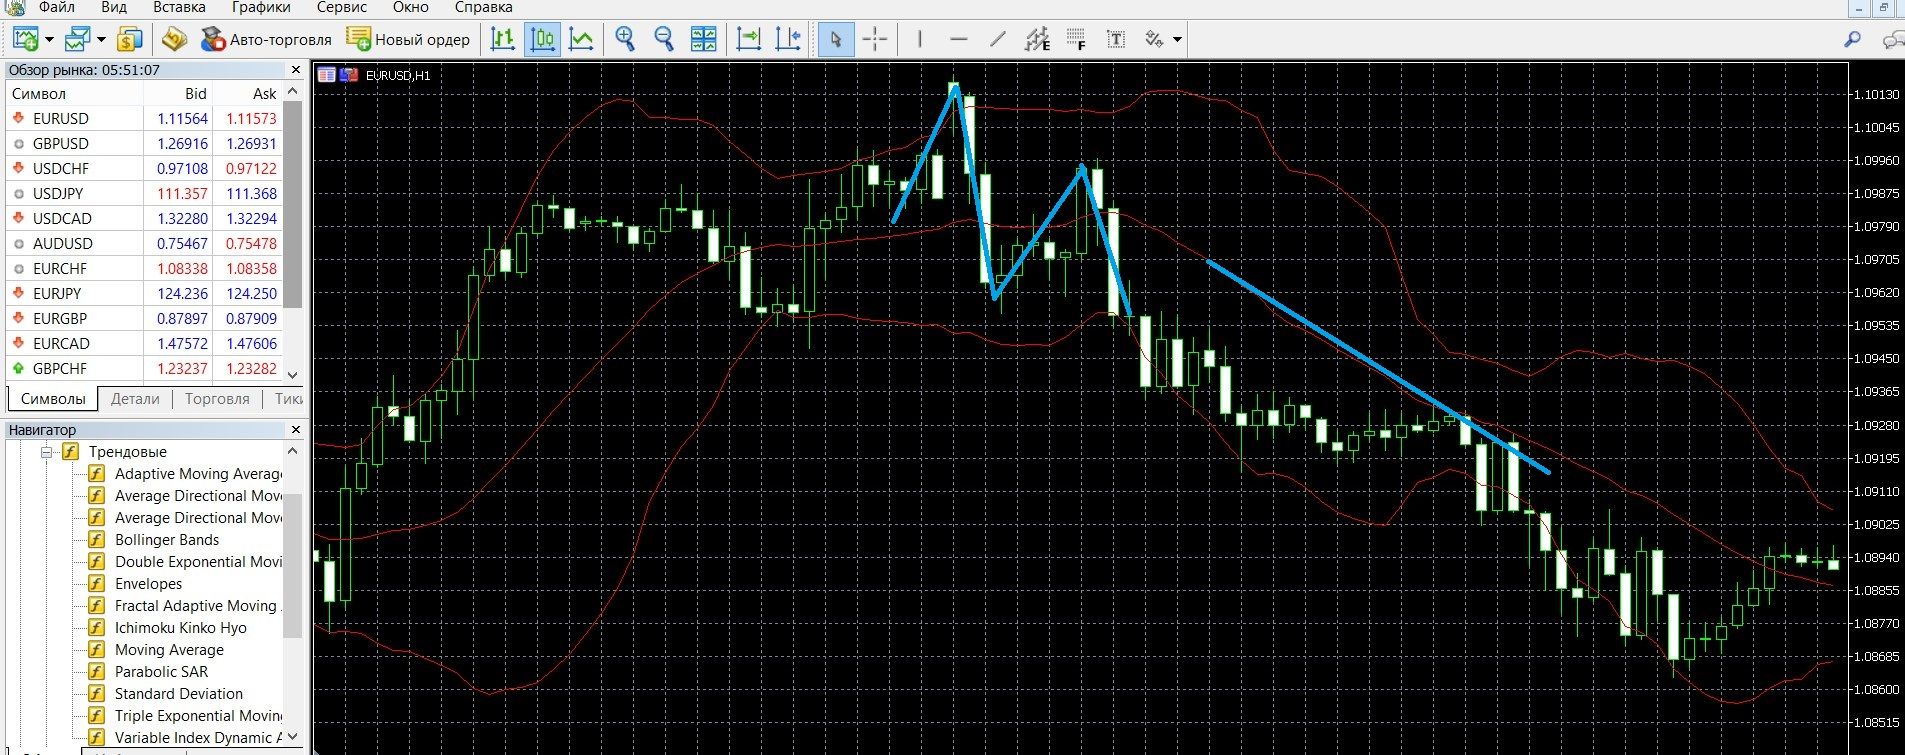
Trading on the signals of figures M and W
- The M model on the Bollinger Bands chart is a strong signal of a downtrend, you can buy a put option (down). In the image below, you can see the downtrend on the MetaTrader 4 platform (make money on the PCI rate on the finmaxbo.com broker’s website, the instructions are listed above):
- The W pattern on the Bollinger Bands chart is a strong signal of an uptrend, you can buy a CALL option (up). In the image below, you can see an uptrend on the MetaTrader 4 platform (make money on the CALL rate on the finmaxbo.com broker’s website, the instructions are listed above):

Money management
Money management is the key to your successful options trading, something that you should use in your work, especially if you plan to receive a stable income from trading. It doesn’t matter if you are a professional or a beginner in options, familiarize yourself with this concept and implement it in your strategy as early as possible. The advantage of money management is that these rules will help you easily build effective work on managing the capital of the deposit. Money management will help you spend your account money economically, as well as trade it in such a way that it is always on deposit, guaranteeing you the continuation of trading.
Basics of money management:
Trading with a minimum of money: it is recommended to spend the minimum possible amount on the purchase of an option; To do this, use no more than 5% of the deposit; Trade options that are worth less than your deposit. Use these rules in your work, and you will save your capital.
Trading with a minimum deposit: it is recommended to spend a minimum of deposit funds; do not bet everything on the purchase of one option; you should know that your funds will still be useful to you; A deposit is something that will require more conscious work: try to allocate a free limit of funds that can be traded and do not go beyond it. Use these rules in your work, and you will save your deposit.
Trading with a minimum number of assets: it is recommended, first of all, for beginners in trading, to first work with 2-3 assets; Only when you become more confident in trading, increase your investment portfolio and try to work with several transactions. Use these rules in your work, and you will make the work with options productive.
Trading without emotions: it is recommended, working in the market, to tune in to serious work; Always remember that not only experience, but also mood determines a lot in your trades; Emotions will interfere with productive work, you will not be able to concentrate and make the right forecast, and even more so to monitor the deposit. Use these rules in your work, and you will achieve success in options.
Expiration
Another leading concept of options trading is expiration. Like money management, it is the factor that will determine the success of your trading. Expiration is the end of trading on a particular asset, when bidders can see the results of their predictions and whether there will be an increase or decrease in the account. A well-thought-out expiration is your reliable strategy and, if you achieve a stable income, expiration will help you come to this.
Types of options:
- Ultra-short options – 30 seconds – 5 minutes.
- Short-term options – 10 minutes – several hours.
- Medium-term options – a day – a few weeks.
- Long-term options – a month – six months.
Is it allowed to extend the expiration?
It is allowed, but not on all trading platforms. If during trading you realize that you have indicated an incorrect forecast, you can extend the expiration and reduce possible losses.
Expiration rules:
- Those traders who are only taking their first steps in options are advised to work first of all with long-term expirations, the advantage of which is stable trading with minimal risks.
- For those traders who are already options professionals, it is necessary, when choosing an expiration, to be based primarily on how convenient and comfortable a particular trading style is for you. When choosing a broker, find out if you can increase the expiration during trading, which minimizes your losses if the forecast is incorrect.
- Those market participants who would like to receive instant income are advised to choose short-term (minute – several hours) expirations, allowing them to earn real capital in 30 seconds. It is worth remembering the risks of express trading.
- Those market participants who would like to receive a stable income from the market should work with long-term expirations, which are characterized by a calm trading style, predictability and the least risk.
Expiration in Bollinger Bands Strategies
Trading with a price breakout signal
Short-term trading: possible, but considered one of the riskiest and most unpredictable on the market; be more attentive to the signals of the Bollinger Bands, use confirmation indicators.
Medium-term expiration: also possible; Bollinger Bands demonstrates high-quality signals, thanks to which you can get a decent income while risking your deposit less than in the case of turbo trading.
Long-term expiration: also possible; Bollinger Bands generate profitable signals that will generate a decent income.
Trading on a reversal signal
Short-term trading: possible, is one of the riskiest and most unpredictable on the market; you should be more attentive to the signals of the Bollinger Bands, use additional trend tools.
Medium-term expiration: also possible; with such trading, the Bollinger Bands will demonstrate high-quality signals, thanks to which you will receive a decent income without risking a deposit as in turbo trading.
Long-term expiration: also possible; Bollinger Bands generate profitable signals that will generate a decent income.
Trading when the market is flat
Short-term trading: possible, although it is one of the riskier in the market; be more attentive to the signals of the Bollinger Bands, use additional trend tools.
Medium-term expiration: also possible; with such trading, the Bollinger Bands will show profitable signals, thanks to which you will receive a decent income without risking a deposit as in express trading.
Long-term expiration: also possible; Bollinger Bands generate profitable signals that will generate good returns.
Trading on the signals of figures M and W
Short-term trading: possible, although it is considered the riskier of all possible on the market; be more attentive to the signals of the Bollinger Bands, add additional trend tools to the chart.
Medium-term expiration: also possible; with such trading, the Bollinger Bands will show enough profitable signals, thanks to which you will receive a decent income.
Long-term expiration: also possible; Bollinger Bands generate profitable signals that will generate a decent income.
Expiration in the “Bollinger Bands+RSI”
strategy
An effective strategy based on the Bollinger Bands and RSI indicators, which allows you to perfectly reduce false signals.
Short-term trading: possible, although considered riskier; both indicators, Bollinger Bands and RSI, work well together, you will be able to see quality signals much easier, but be careful when turbo trading.
Medium-term expiration: also possible; with such trading, thanks to the confirming RSI signals, you will get enough profitable signals and will be able to earn a decent income.
Long-term expiration: also possible; with such trading, thanks to the use of RSI, you will get enough profitable signals, and you will be able to make decent money.
When trying your hand at trading, study and try out expiration options in order to determine a more comfortable trading style for you. To do this, use the convenient platform of a trusted broker Finmax. Among its advantages: a functional terminal with a convenient personal account, the ability to choose options and expiration dates (from 30 seconds to six months), etc. Start building your profitable strategy now by going to the finmaxbo.com broker’s website.
Downloads
MetaTrader 4 (MT4) platform – download.
Bollinger Bands indicator for the MT4 platform – download.
Tagged with: Binary Options Indicator • Bollinger