
Trading on Trend Lines
Graphical elements are found in all popular trading terminals (trend lines, support and resistance levels, Fibonacci lines, channels, etc.). All of them are designed to help the trader in accurately determining the market trend, high-quality signals that will help to get a guaranteed income.
A trend is a sequence of higher highs and lows, which is true for an uptrend, and a sequence of lower highs and lows for a downtrend. Trend lines are graphical lines that are drawn at an angle above or below the price, which indicate the development of a trend or the moment of its reversal.
Working with the trend line, you can clearly see its nature and intensity, which can be used when buying CALL and PUT binary options. It is also customary to consider them as support and resistance levels that allow you to open trades when the price touches the trend line. At the same time, the trend line not only shows the trends of the market (upward, downward, flat), but also its slowdown, change of direction and reversal.
How to plot Trend Lines on a chart?
There is a simple rule for working with trend lines:
- In the case of a downtrend, the lines are drawn at highs above the price, at the top,
- In an uptrend, trend lines are drawn at lows below the price, below.
Before drawing a trend line on the price chart, there should be at least two highs or lows on the chart, but for reliability, it is drawn when there are three lows or highs on the chart. To add it to the chart, you need to take one minimum or maximum value and connect it to another, after which the line stretches further. For an ideal trend line, points 1 and 2 are at a certain distance from each other.
See what the Trend Line looks like on the chart of the MetaTrader 4 terminal in the image below. You can also quickly download the MetaTrader 4 platform and study the tool in more detail:

Features of Trend Lines
In order to properly use trend lines and get profitable trades, you need to pay attention to their behavior and observe them, study their capabilities, find options when:
- the trend line works as support or resistance;
- The line works as a breakout.
To study these scenarios, you will need: working with Japanese candlesticks, indicators, technical analysis, working with expiration, the presence of hot news that affects the movement of market quotes.
Upward trend line
The ascending line is inclined upwards with the right end, downwards with the left end and is formed when the lows are connected. When drawing such a line, each late minimum must necessarily be higher than the previous minimums. Ascending lines resemble support, indicate an increase in demand despite the price increase, and the market reacts positively to the stock (commodity, bond, etc.) that there are more buyers than sellers.
If the price is above the ascending line, then the trend is strong. If there is a breakdown of the ascending line, the ratio of supply and demand has changed, there will be a change in price movement.
Downward trend line
The descending line is inclined downwards with the right ends and upwards with the left end, formed when the highs are connected. At the same time, late highs should be lower than previous highs. These lines are compared to resistance lines. They say that the supply is growing despite the falling price.
With an increased supply and a falling price, the market reacts negatively to the asset, there are more sellers than buyers. As long as the price is below the descending line, this trend will be solid. The breakdown of this line demonstrates a change in supply and demand, which will lead to a change in market dynamics.
Do I need to install Trend Lines in your platform?
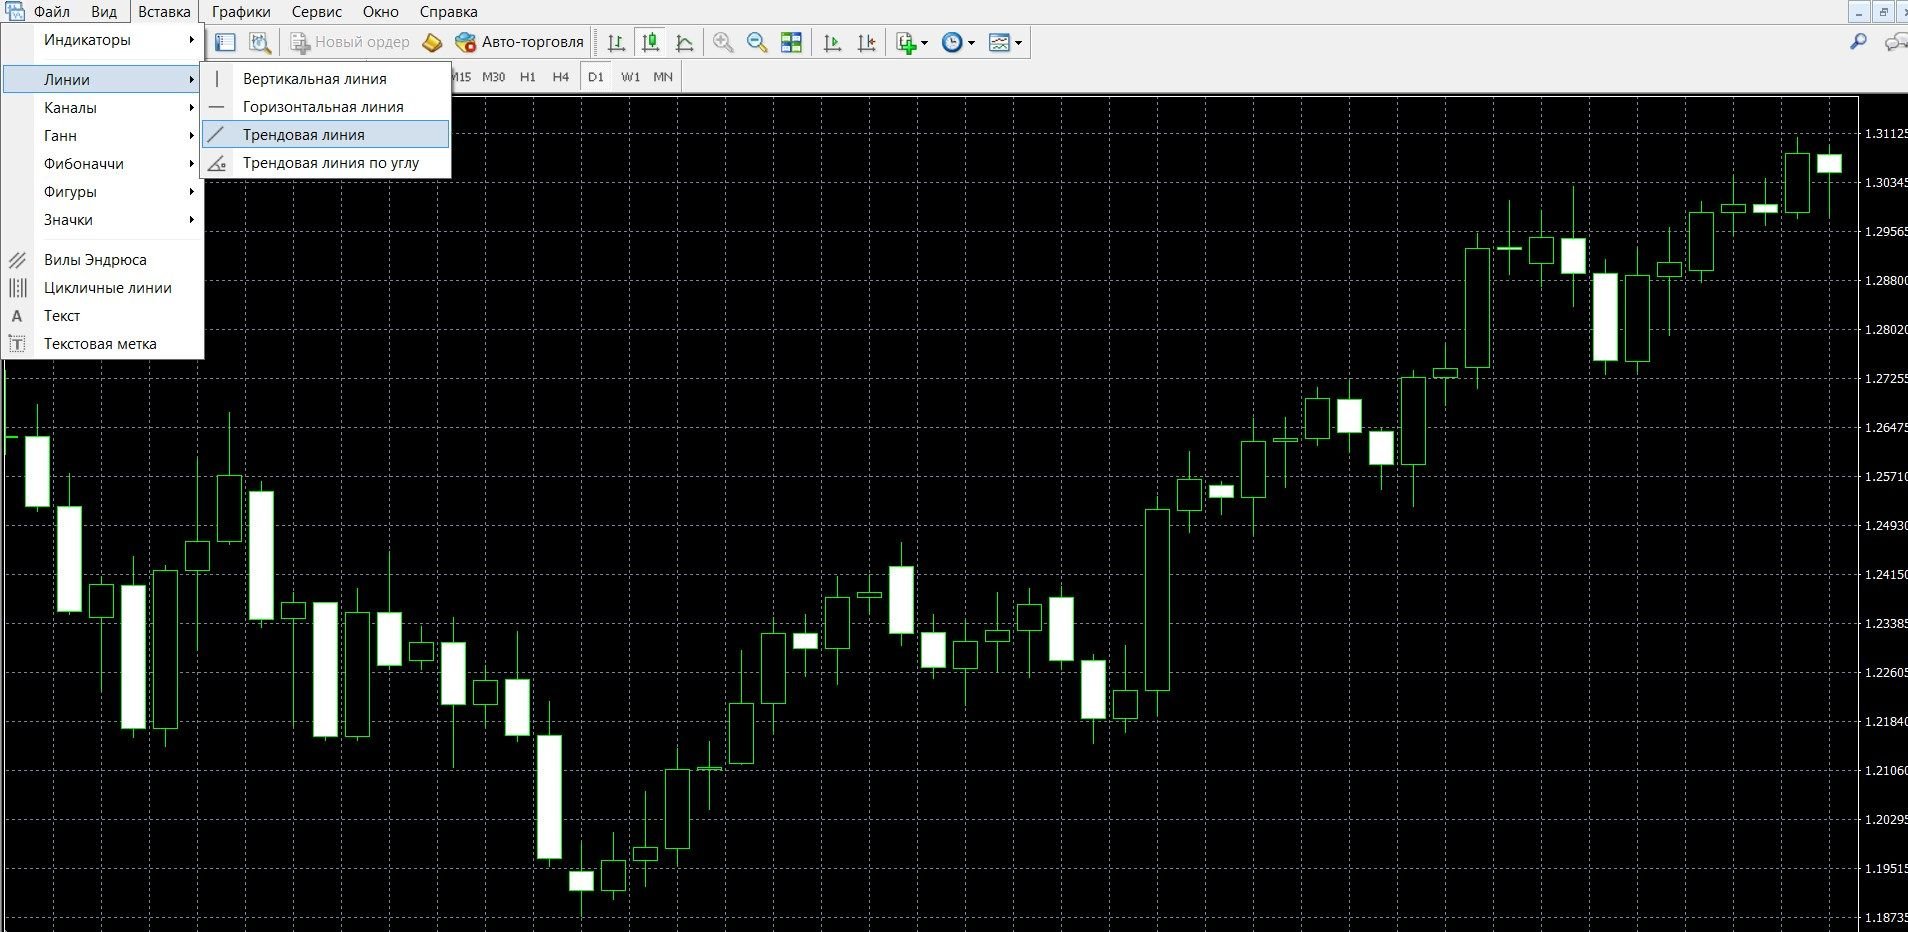
Trend lines are a standard trader’s tool, which is included in most brokers’ trading terminals, and it is also available in the MetaTrader 4 platform. To add lines to the price chart, take the following steps:
- Click the “Insert” tab in the top menu of the platform
- Select the tab “Lines” – “Trend line”
- The tool has been added to the chart, you can work:
How to trade on Trend Lines?
There are two ways to trade trend lines:
Trend line as support and resistance
As soon as you have identified a trend line as support or resistance, you can open a position at the moment the price returns to it:
- in a downtrend, the lines act as resistance, are drawn at highs above the price, at the top, this is a signal to buy a put option,
- in an uptrend, the lines act as support, are drawn at lows below the price, below, this is a signal to buy a call option.
Breakout of the Trend Line
In this case, trades are opened when the price breaks through the trend line. If the price has broken through the trend line, the trend ceases to act as support or resistance, there is a high probability of a trend change. There are two ways to enter a trade in case of a breakout:
Aggressive entry
A trade should be opened when the candlestick breaks through the trend line and closes above it.
Conservative entry
It is necessary to wait for the price to break through the trend line and test it as support or resistance. Only after that you can open positions. The strategy involves the purchase of an option in the direction of the trend. To enter it, you need to wait for the moment when the price touches the trend line:
- If the candle closes in an uptrend, it is worth buying a call option,
- If the candle closes below the trend line, we have a downward trend in front of us, it is worth buying a put option.
For reliability, when working with trend lines, use confirmatory indicators, for example, RSI, MA.
Rules for concluding transactions (screenshots)
Trading with a support and resistance signal
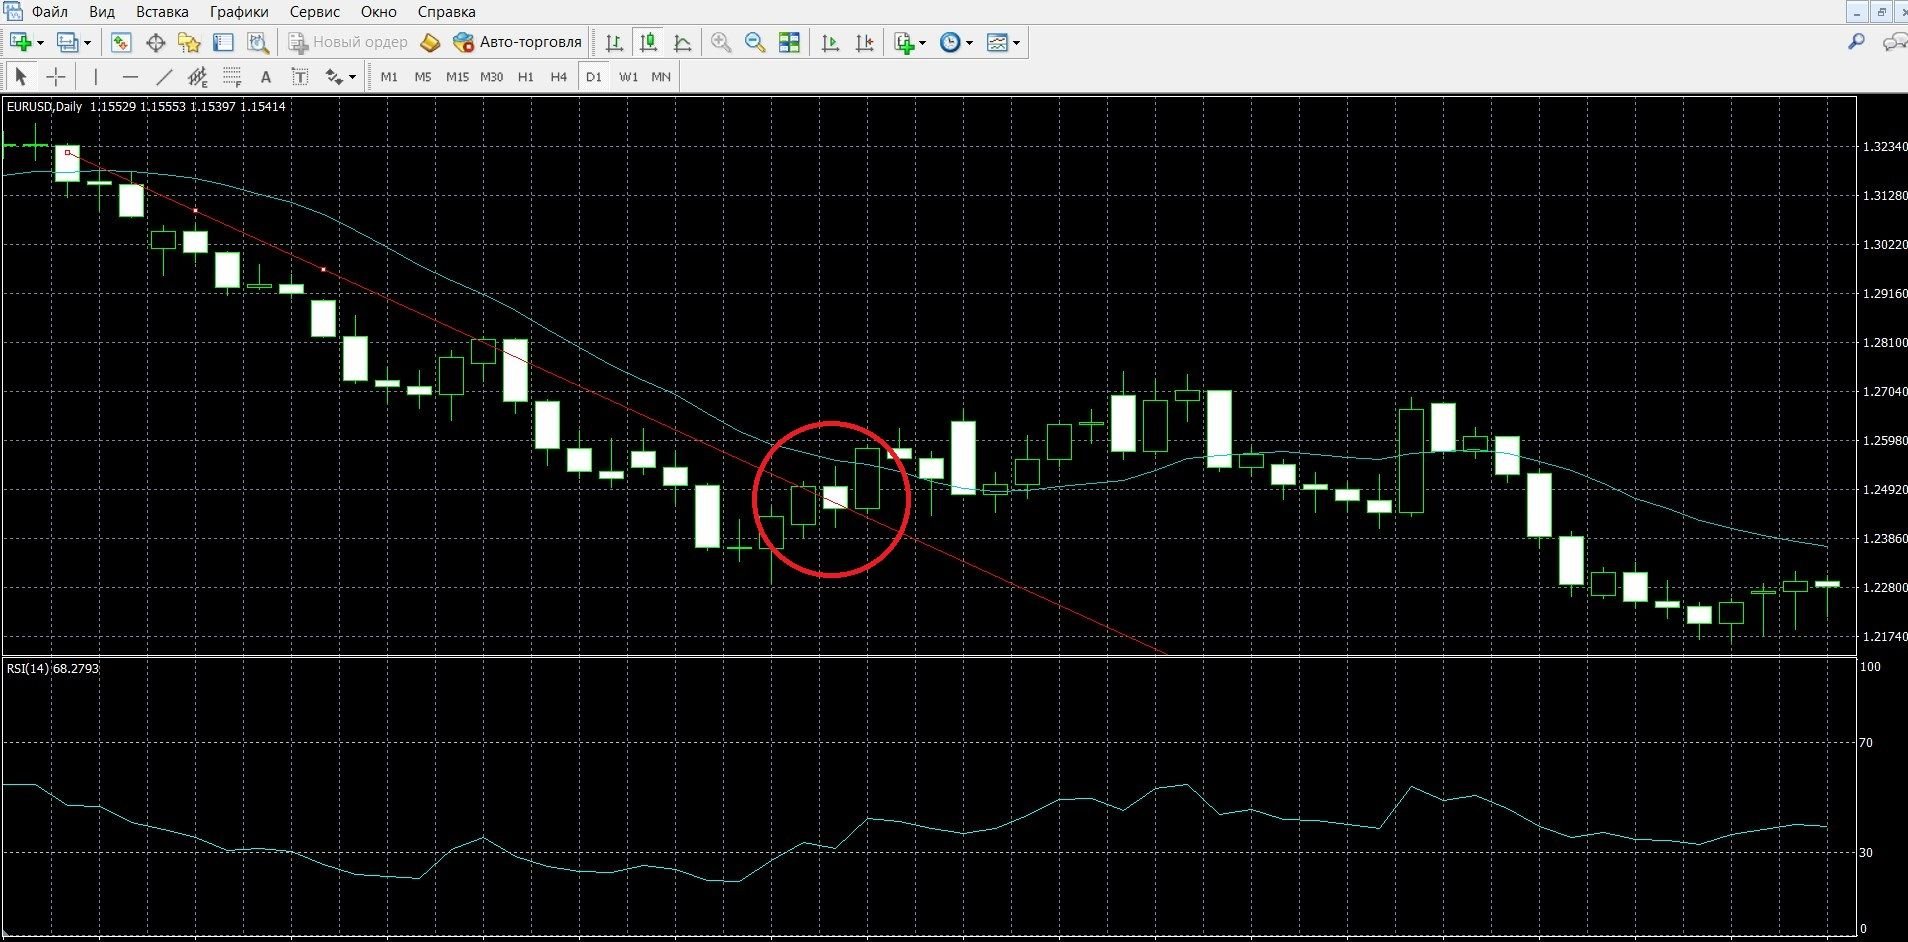
In a downtrend, the lines act as resistance, are drawn at highs above the price, at the top, this is a signal to buy a PUT option. The image shows the downward trend in the MT4 terminal:
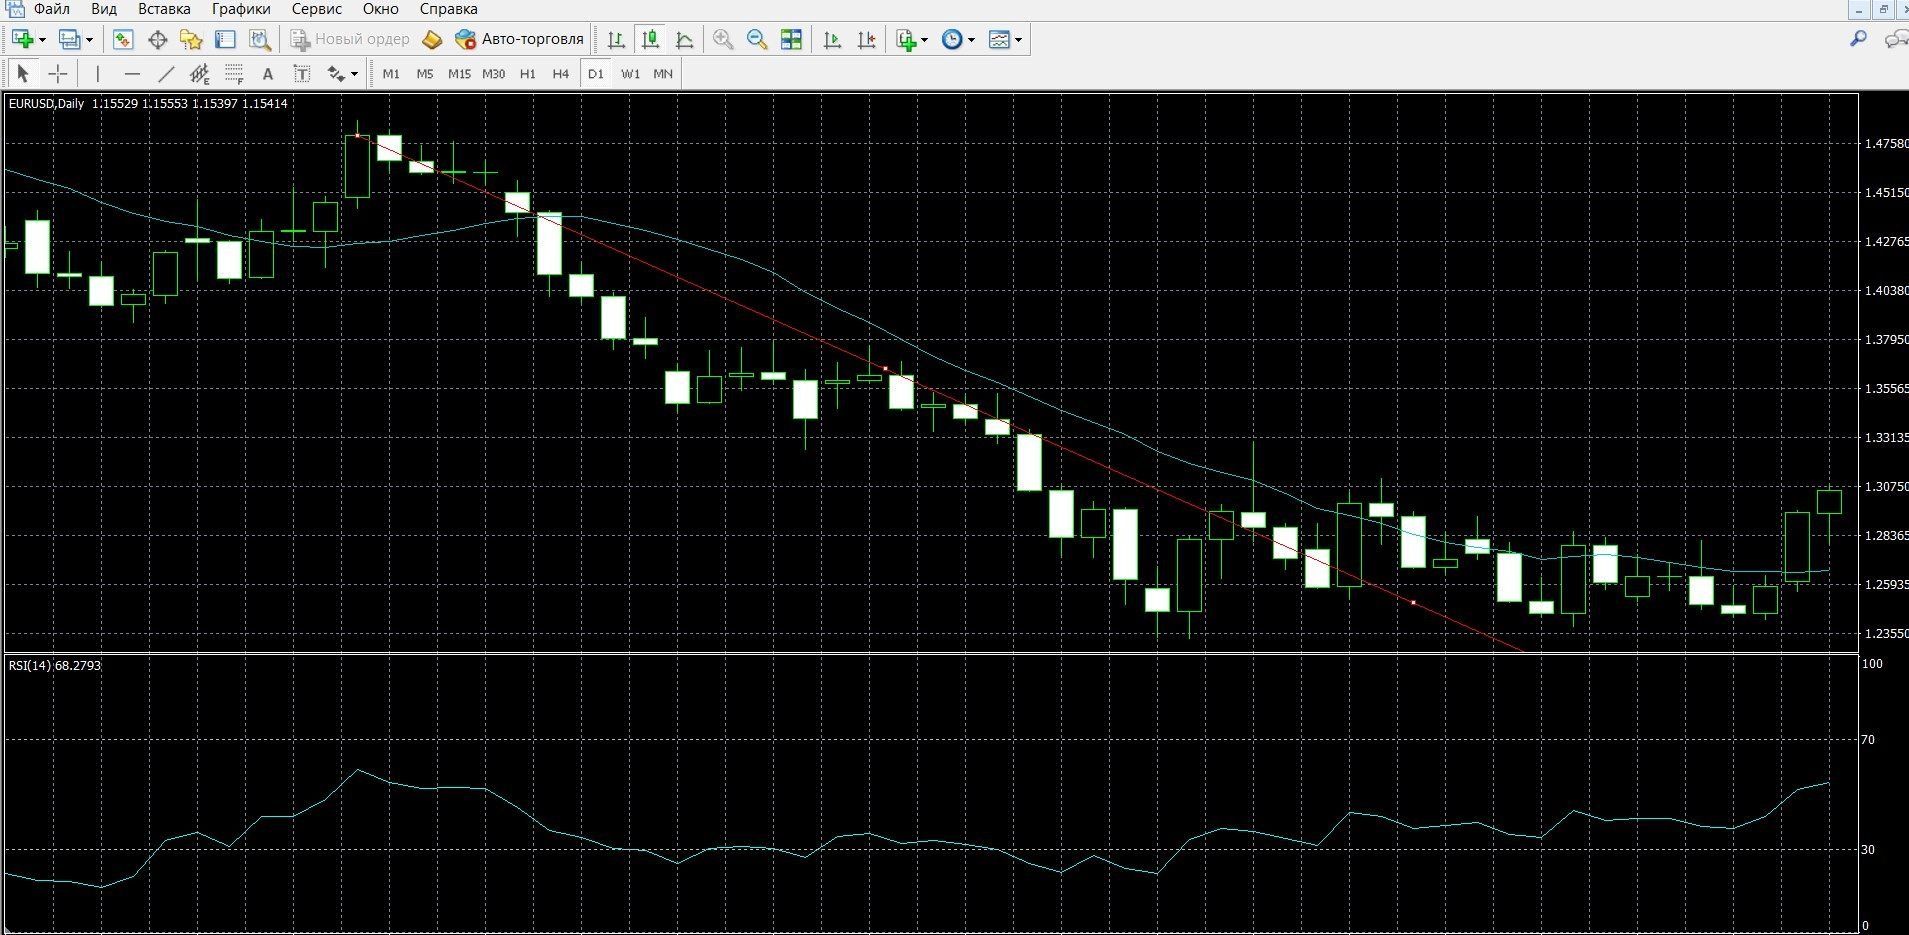
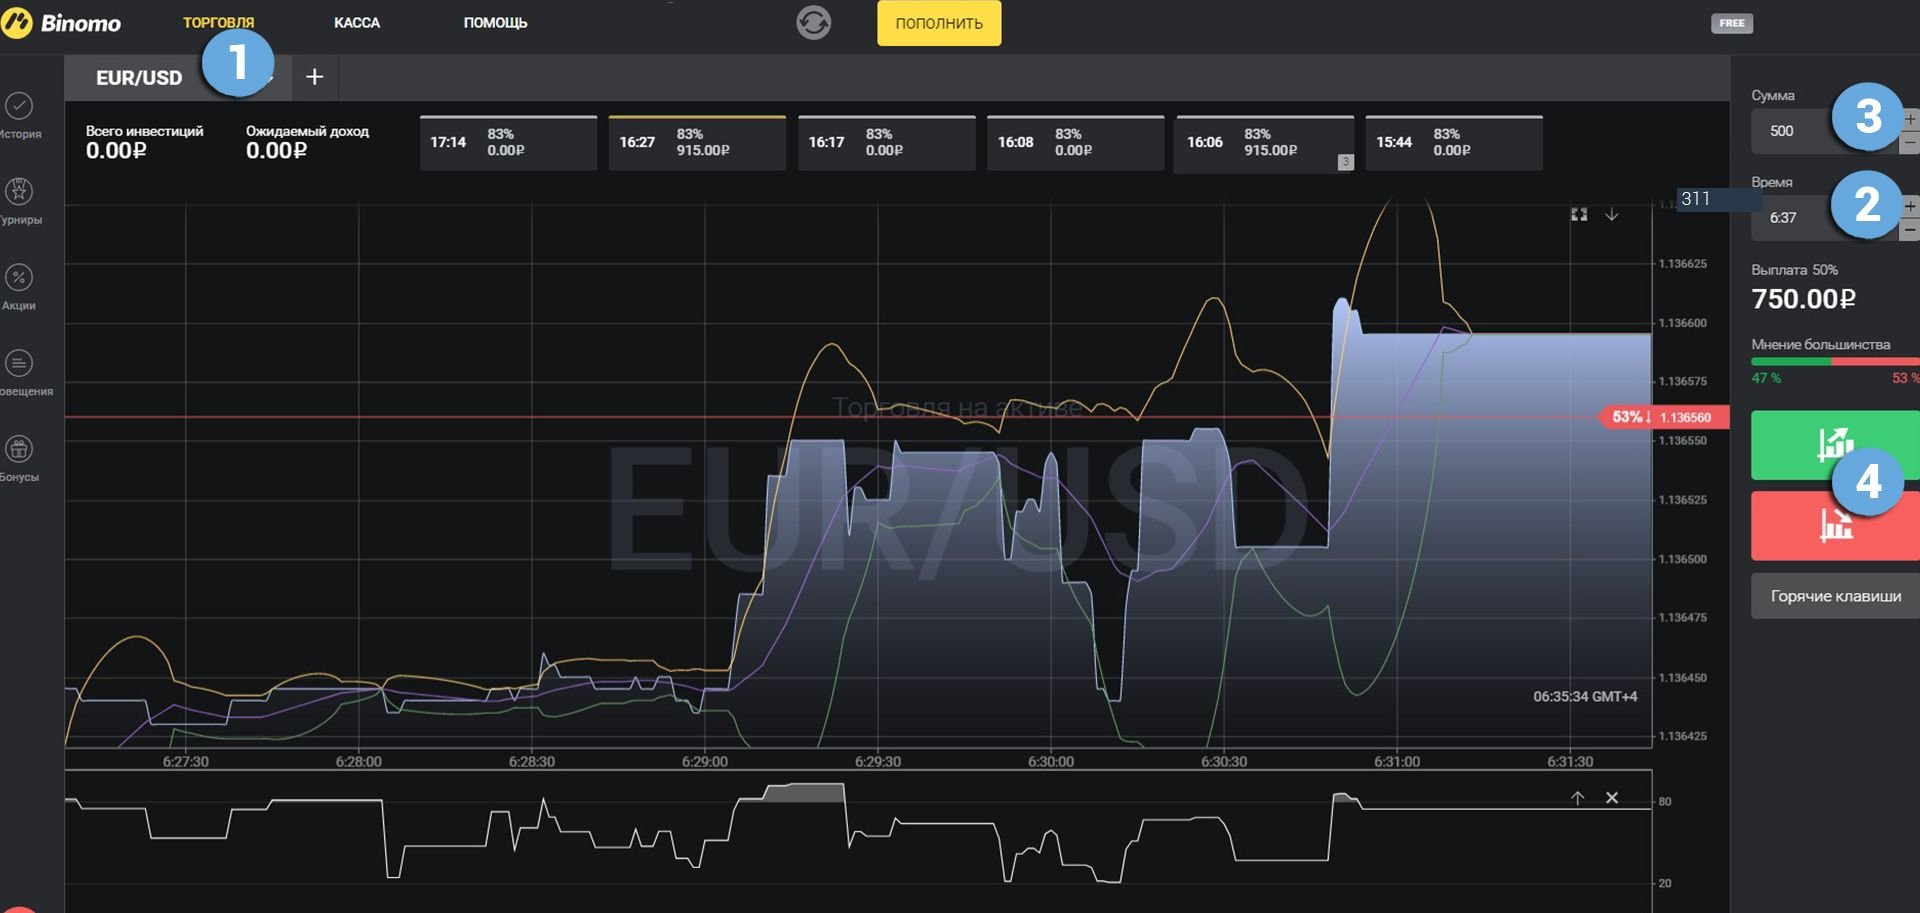
Take advantage of the trend and place a PUT bet with the Binomo broker by going to the binomo.com website and preparing an option, indicating:
- Type of option
- Expiration date
- Amount
- Prediction: down
- Next, click the “buy” button and wait for the results of the forecast:
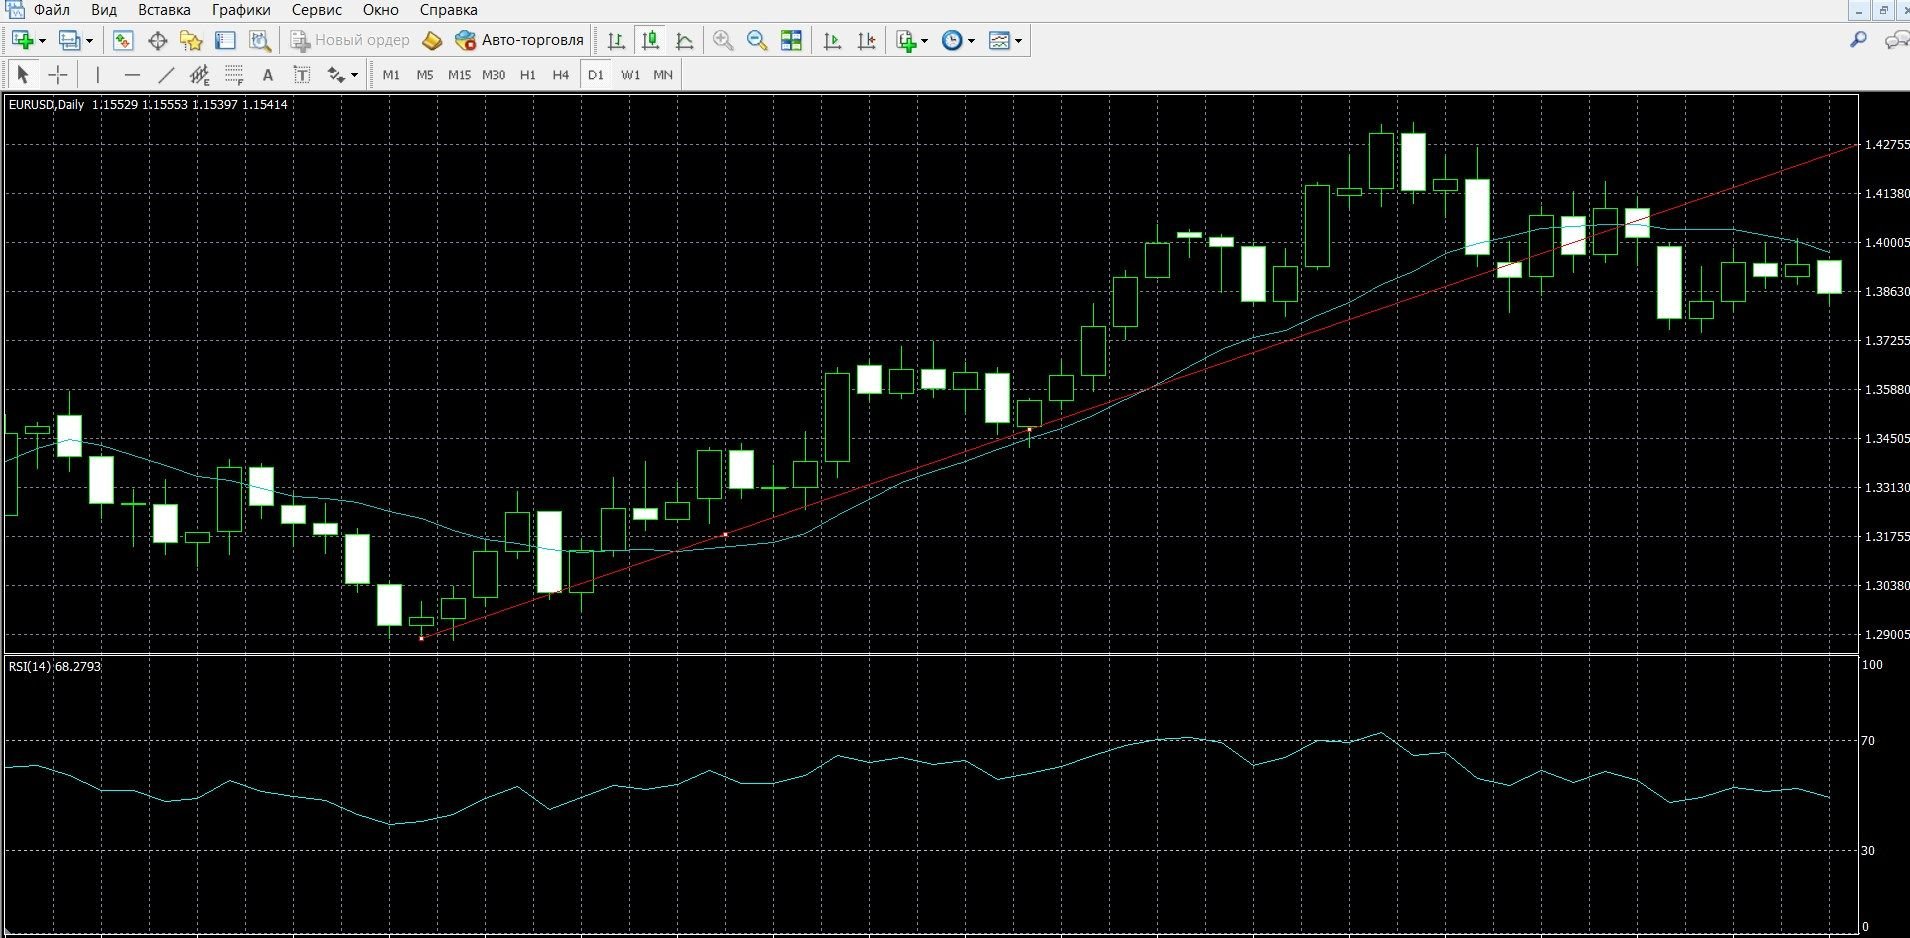
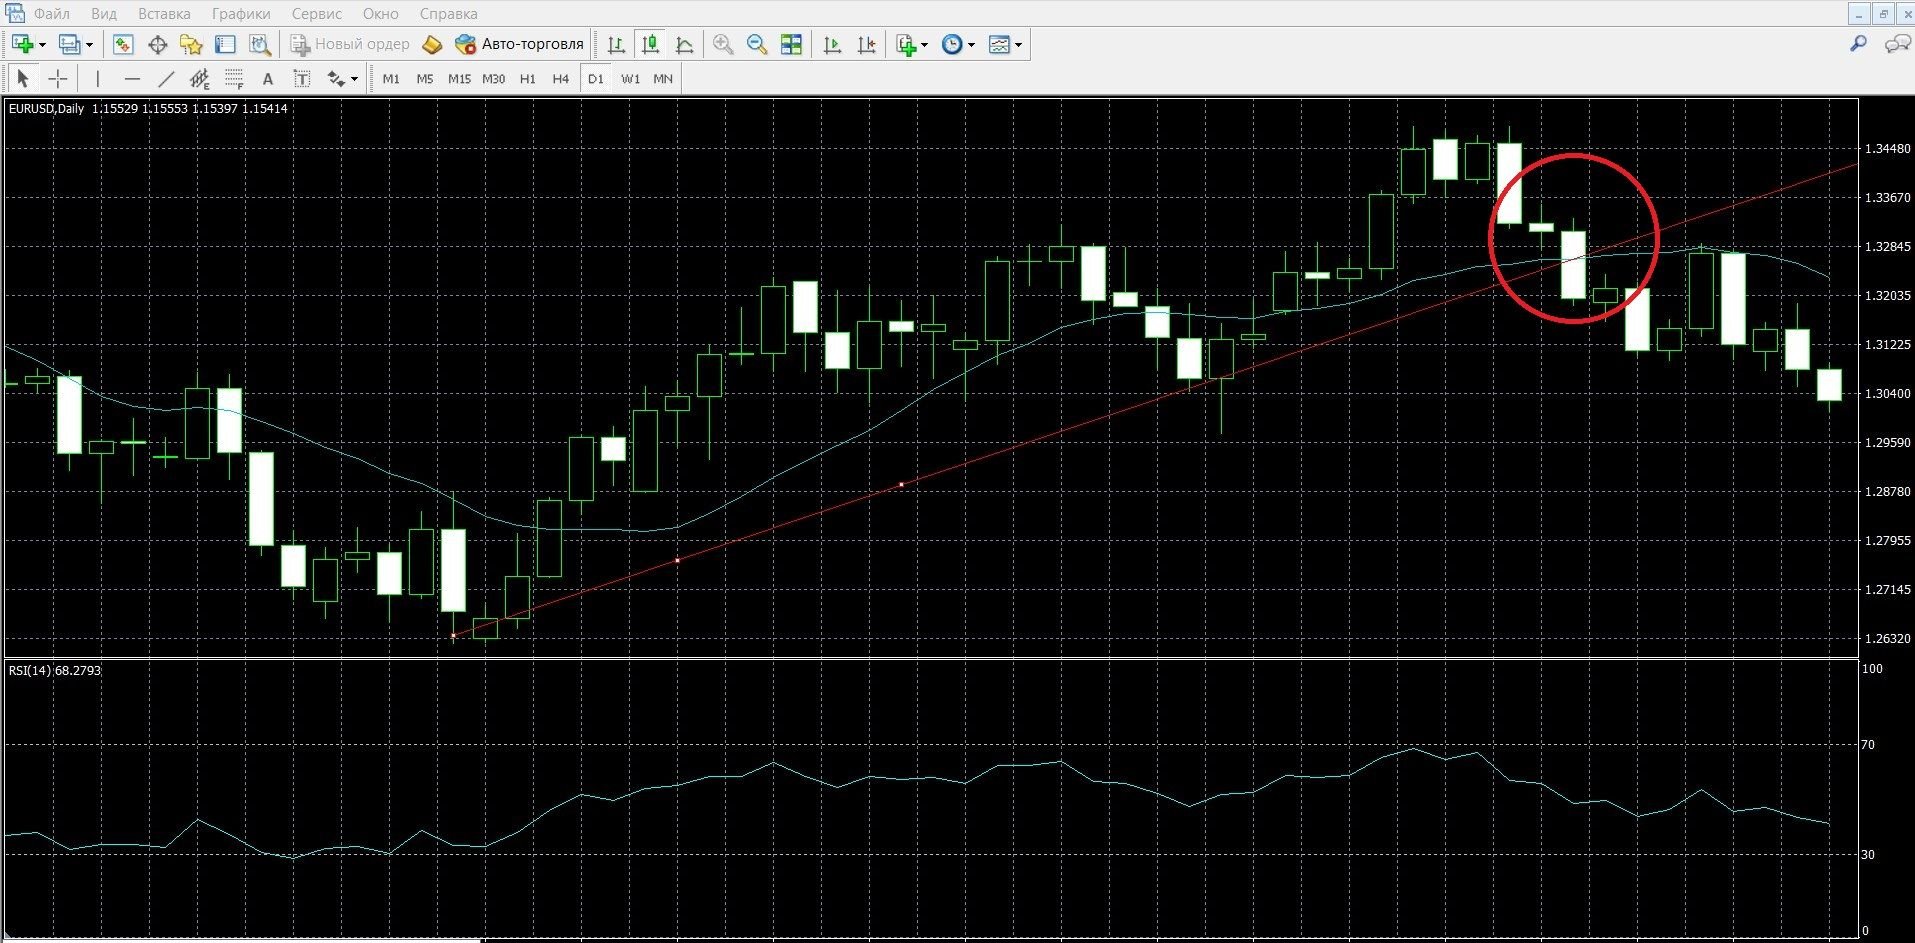
In an uptrend, the lines act as support, are drawn at lows below the price, below, this is a signal to buy a CALL option. The image shows the upward trend in the MT4 terminal:
Take advantage of the trend and place a CALL bet with the Binomo broker by going to the binomo.com website and preparing an option, indicating:
- Type of option
- Expiration date
- Amount
- Prediction: up
- Next, click the “buy” button and wait for the results of the forecast:
Open a demo account with Binomo
Trading when the trend line is broken
If the candle closes in an uptrend, it is worth buying a call option. In the image, you can see the uptrend in the MT4 terminal (taking advantage of the trend, place a CALL bet on the binomo.com website, the instructions are listed above):
If the candle closes below the trend line, we have a downward trend in front of us, it is worth buying a put option. In the image, you can see the downtrend in the MT4 terminal (taking advantage of the trend, place a PUT bet on the binomo.com website, the instructions are listed above):
Findings
In order for the Trend Line to become your successful profitable trading strategy, remember that:
- It is better to trade in the direction of the trend line.
- The trend line acts as support and resistance, use it correctly.
- Strong tendencies precede a sharp reversal of the trend.
- Confirm the signals of the lines with additional binary options indicators.
- Test the capabilities of trend lines.
- Create your profitable strategy based on trend lines.