
RSI indicator
The Relative Strength Index (RSI) binary options indicator is one of the most popular tools for market players. It was created in 1978 by trader Welles Wilder, the world learned about it after its publication in Commodities magazine. Wilder was fond of making money in the financial markets, is the author of several unique market forecasting tools at once. The Relative Strength Index is his most famous development.
You can read a detailed overview of RSI here.
Popular indicators developed by Wilder are Parabolic SAR, Average True Range (ATR) and Average Directional Movement Index (ADX). These classic tools are not only widely used among traders, but are also included in a number of productive trading strategies . The RSI should not be confused with relative strength, which compares security performance to the overall market average or index (e.g., the Dow Jones Industrial Average).
RSI Basics
The Relative Strength Index (RSI) is one of the technical indicators better known as inertia oscillators. Similar popular pulse generators are the MACD and the Stochastic Oscillator. The principle of the indicator is that it compares the absolute values of the growth and decline of the market for a specific period of time. It determines the strength of the trend and the probability of its reversal. The popularity of the RSI is due to its simplicity of interpretation. The indicator chart repeats the price chart, the price lows correspond to the lows on the RSI chart, and the price highs correspond to the RSI highs.
The RSI measures the speed and magnitude of price movement, displaying data between 0 and 100. Indicators are calculated based on data on the average profit and loss from an asset over a specific period of time. The fact that the RSI readings range from 0 to 100 helps to highlight the fixed overbought and oversold areas. The main parameter of the indicator setting: period. By default, it is 14, but it can be changed depending on the strategy. When the indicator decreases, the sensitivity of the indicator increases, creating more overbought and oversold signals; With an increase in the period indicator, on the contrary, sensitivity decreases, there are fewer signals.
RSI formula:
RSI = 100 — 100 / (1+RS)
Overbought and oversold signals
The most popular way to use RSI is when looking for overbought or oversold areas:
- If the indicator is above the 70 mark, it is an overbought signal;
- If the indicator chart is within the range of up to 30, it is an oversold signal.
Thus, the RSI shows the dominant forces of the market:
- If the indicator is above 30, this is a bullish trend (uptrend) indicating the strength of buyers in the market;
- If the indicator chart is located below the indicator 70, this is a bearish trend (downtrend), indicating the strength of sellers in the market.
Like other momentum oscillators , the overbought and oversold signal works better not during a trend, but when the price moves sideways. The indicator is common in trading strategies as a reliable trigger for determining the optimal entry and exit area.
Divergence signals
The author of the indicator says that the discrepancies between the price chart and the readings of the RSI oscillator will indicate a potential reversal. Divergence and convergence signals are quite common. They occur when the price chart is not supported by the indicator readings. Such inconsistencies, appearing at the moments of the trend: upward or downward, always warn of the imminent end of the trend.
Divergence is a bearish signal that occurs on an uptrend when price sets new peaks but the indicator does not. In this case, you need to buy a call option.
Convergence is a bullish signal that occurs on a downtrend when price sets new lows but the indicator does not. In this case, you need to buy a PUT option.
Divergence and convergence signals for RSI:
A bullish divergence occurs when the underlying asset is at a low low position and the RSI, on the contrary, is at a high low. The RSI readings diverge from the bearish trend of the price chart, showing a strengthening of momentum and, as a result, a potential upward reversal in price.
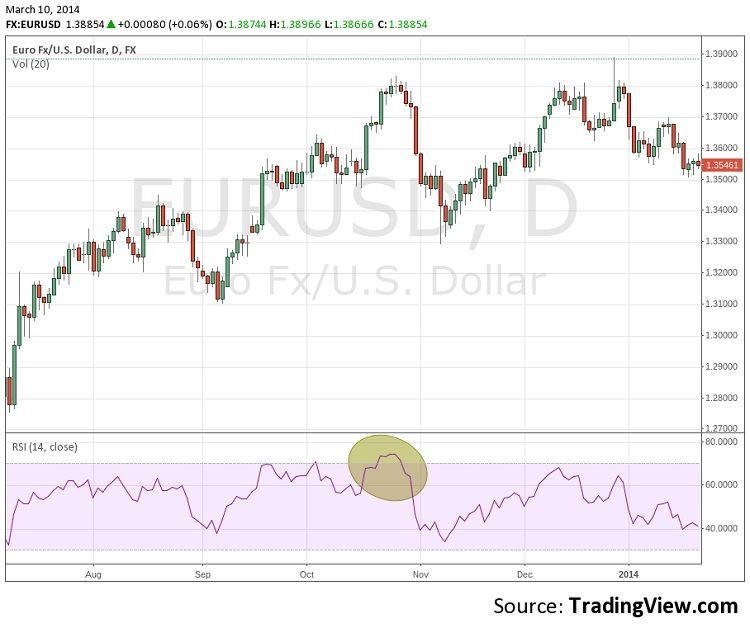
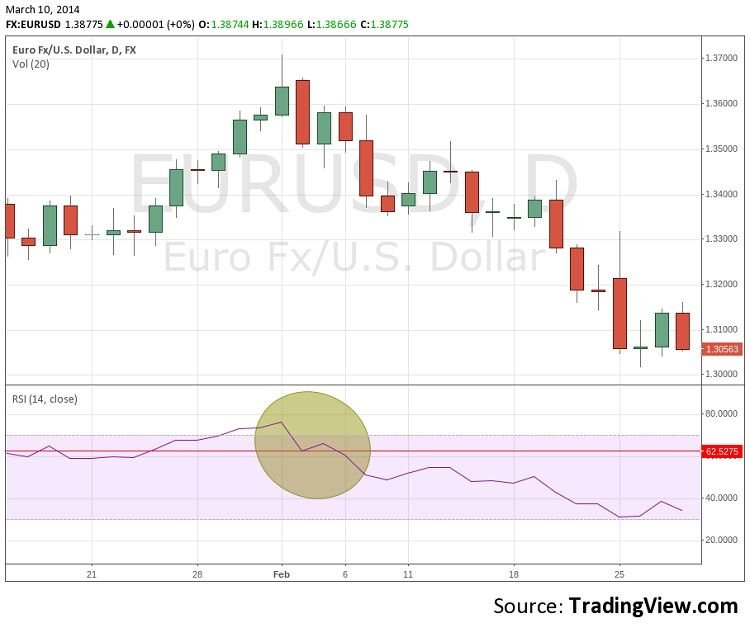
A bearish divergence occurs when the underlying asset is at a high position, and the RSI chart, on the contrary, forms a low high. The RSI readings diverge from the price signals, showing a weakening of momentum, and, as a result, a potential downward reversal in price.
Popular indicators indicating divergence and convergence signals are RSI, Stochastic, MACD. Searching for these signals is a profitable strategy, simple and effective. To obtain reliable signals, it is recommended to use several indicators.
Failure fluctuations
Wilder, describing the possibilities of the RSI, points to another indicator of a potential reversal of price dynamics – the “failure fluctuation” that occurs in the case of:
- a failed bullish swing form, when the RSI first moves below 30, then rises above 30 and pulls again, being above the 30 level. Such a failed swing will be completed when the RSI line breaks its high – this breakout is a bullish signal.
- a failed bearish swing form, when the RSI is first above 70, then drops below 70 and rises again, being below the 70 mark. Such a failed swing will be completed when the RSI line breaks its low – this breakout is a bearish signal.
RSI: How to Exploit Data Inconsistencies
RSI generates reliable signals of the state of the market, but it is still worth remembering that the indicator can give false signals, so we recommend using signals from other oscillators as confirmation. However, the discrepancy between the RSI data can be applied in a trending market:
For example, during a strong uptrend, the RSI can only move between levels 40 and 80. Falling to the 40 mark, the indicator will signal a bullish reversal area (resumption of the uptrend), the 80 level can be seen as an overbought area. Also, with a strong downtrend, the RSI can be at levels between 60 and 20. Here, level 60 can be considered a potential area of a downward reversal (resumption of a downtrend), level 20 can be considered as an oversold area.
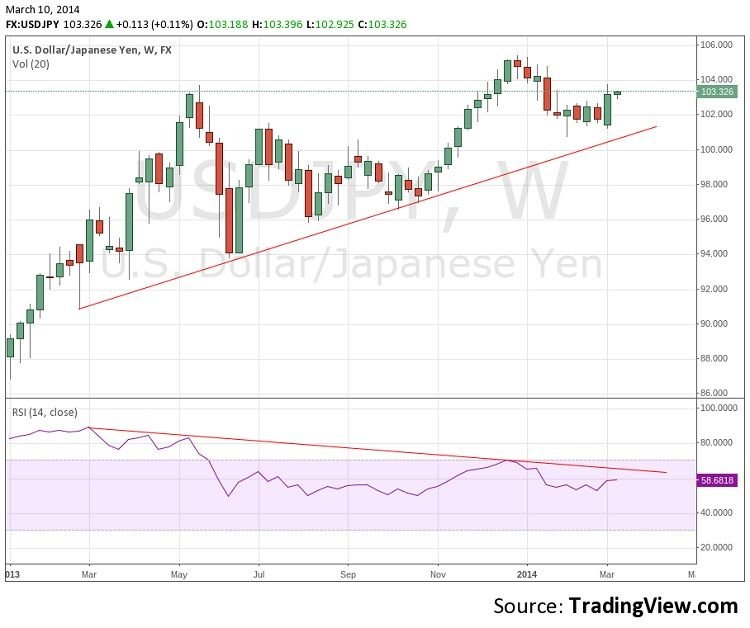
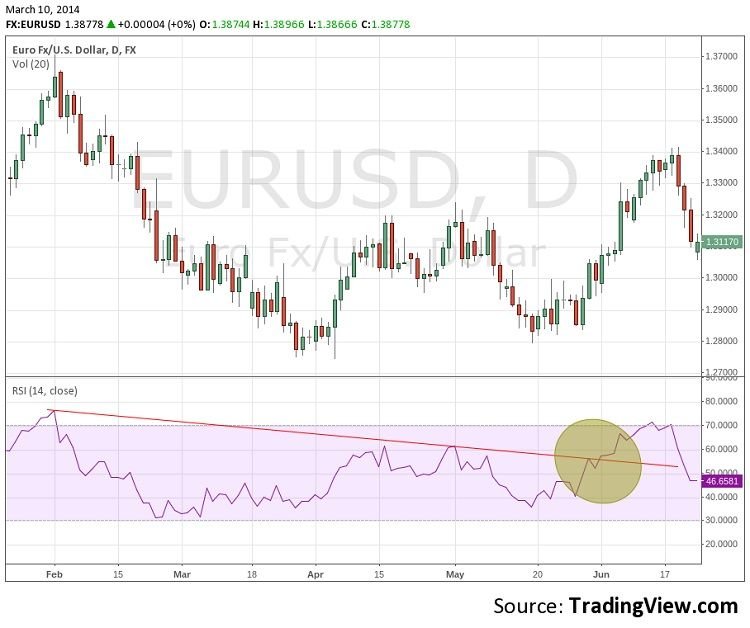
RSI: Trend Line Breakouts
Using trend lines with an indicator is a simple but effective strategy. In this case, thanks to the RSI, you will receive breakout signals much earlier than the price chart.
In an uptrend, the trend line shows a forward upward movement in which higher lows and highs are formed. When one of the lows is broken, it indicates a possible trend reversal. The same thing happens in a downward trend.
When applying trend lines on the RSI oscillator itself, it is necessary to be aware of possible breakouts above or below the lines, which will demonstrate a potential change in market trend.
Most importantly, a breakout of the support line will indicate a high-quality price reversal signal in advance. When using RSI, you should not limit yourself to overbought and oversold signals, which are considered riskier trades. It is worth paying attention to the fact whether the RSI line is forming a trend, and where the trend lines are broken, this can give high-quality warning signals about a trend change.
Trading with RSI with FinMax broker
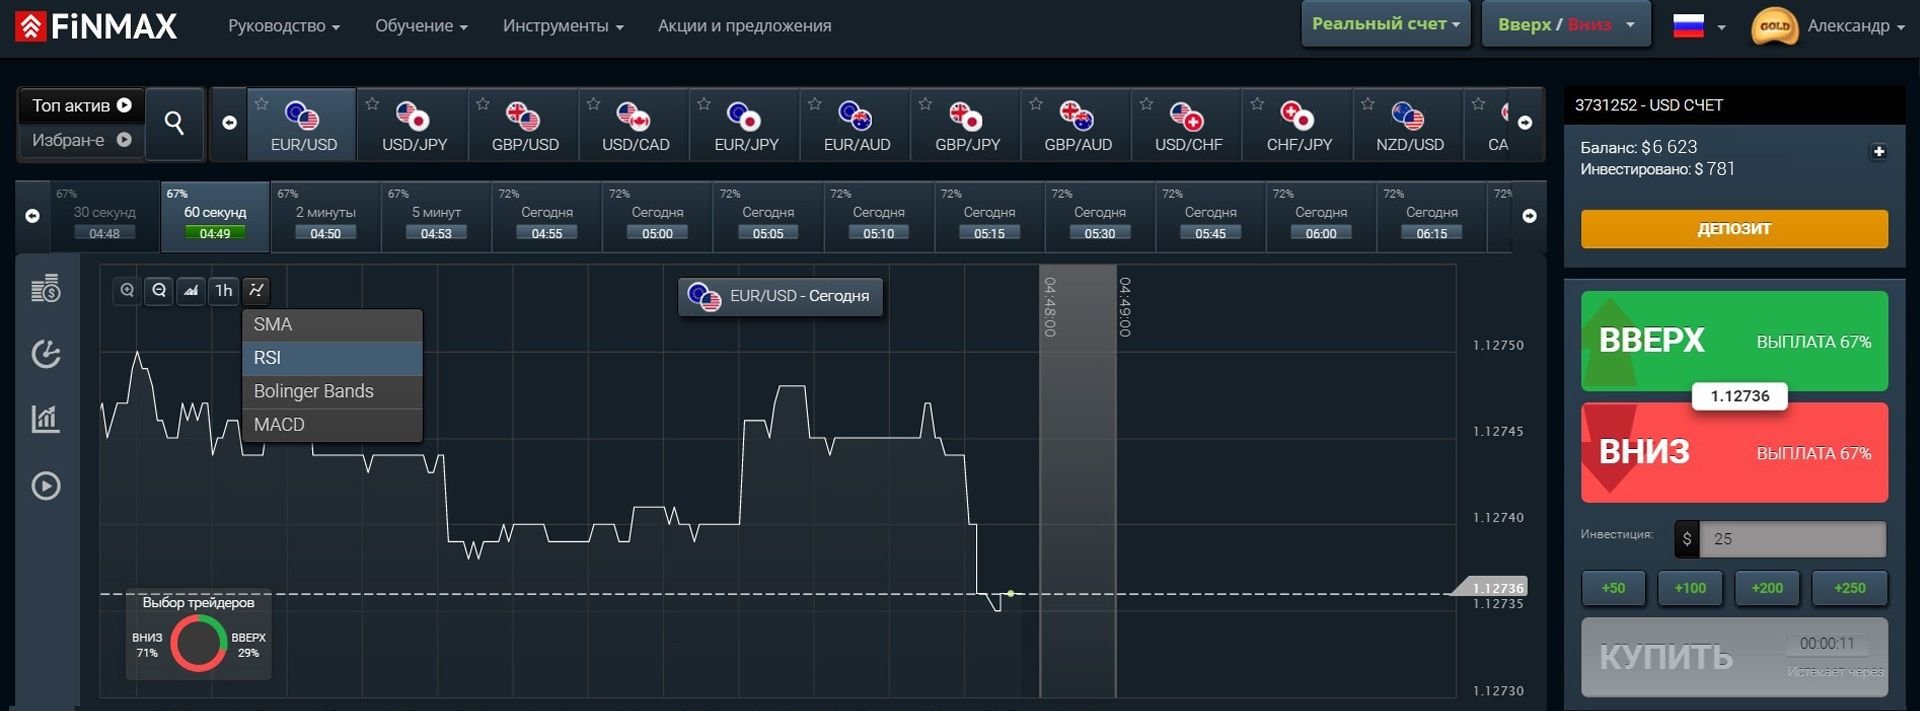
The RSI indicator is presented in most modern trading platforms. We recommend that you take advantage of its capabilities from a trusted broker FinMax. To do this, you just need to go to the finmaxbo.com website. On the main page, you can add RSI to the chart by clicking the indicator tab:
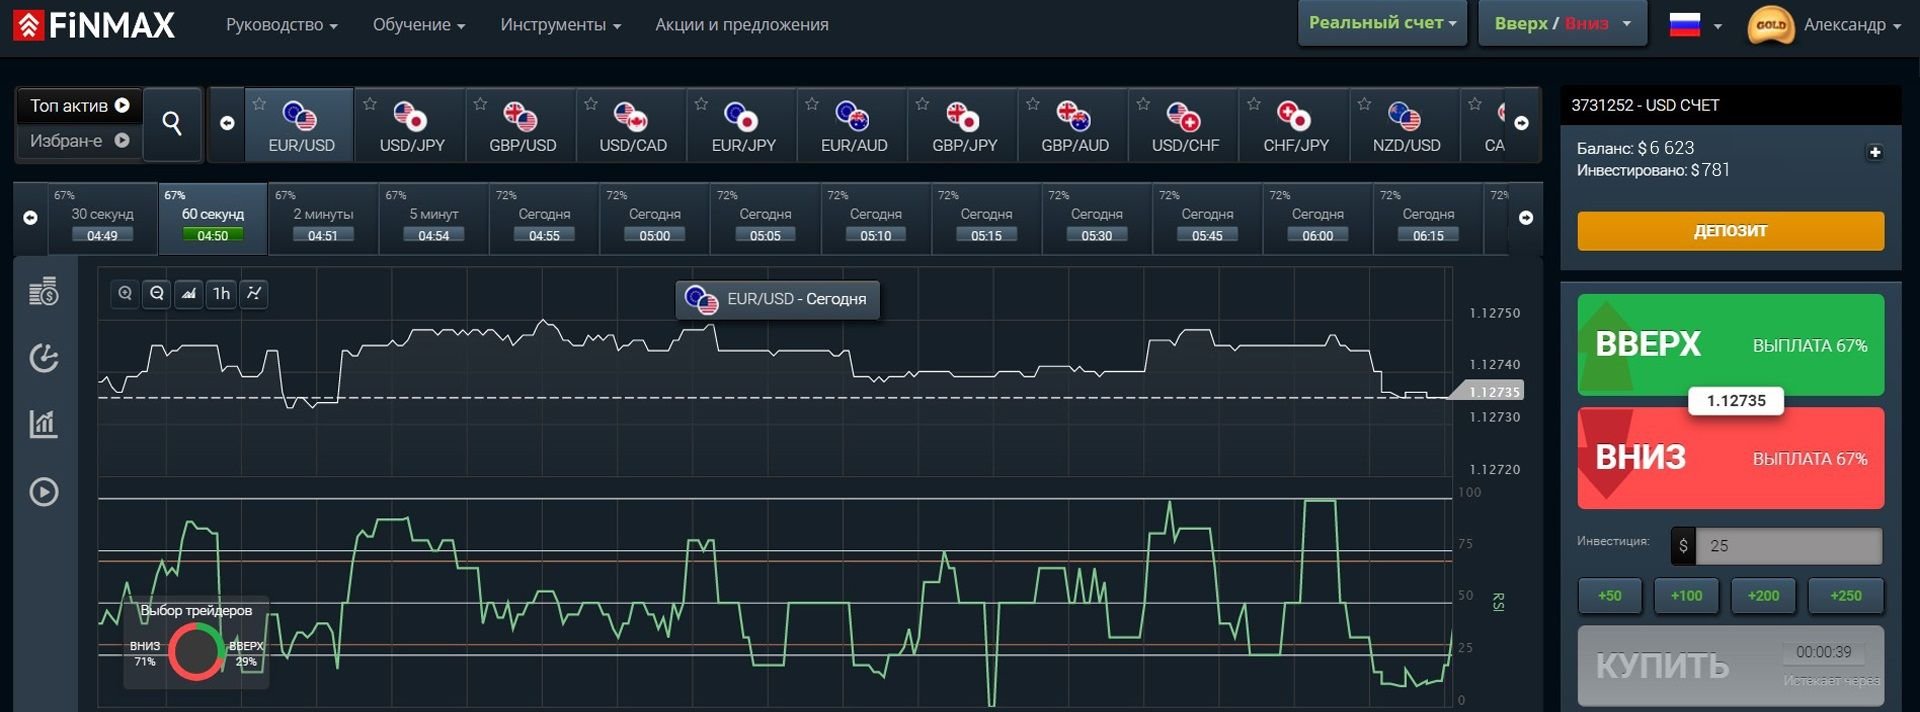
After the indicator is added to the chart, you can start working with it:
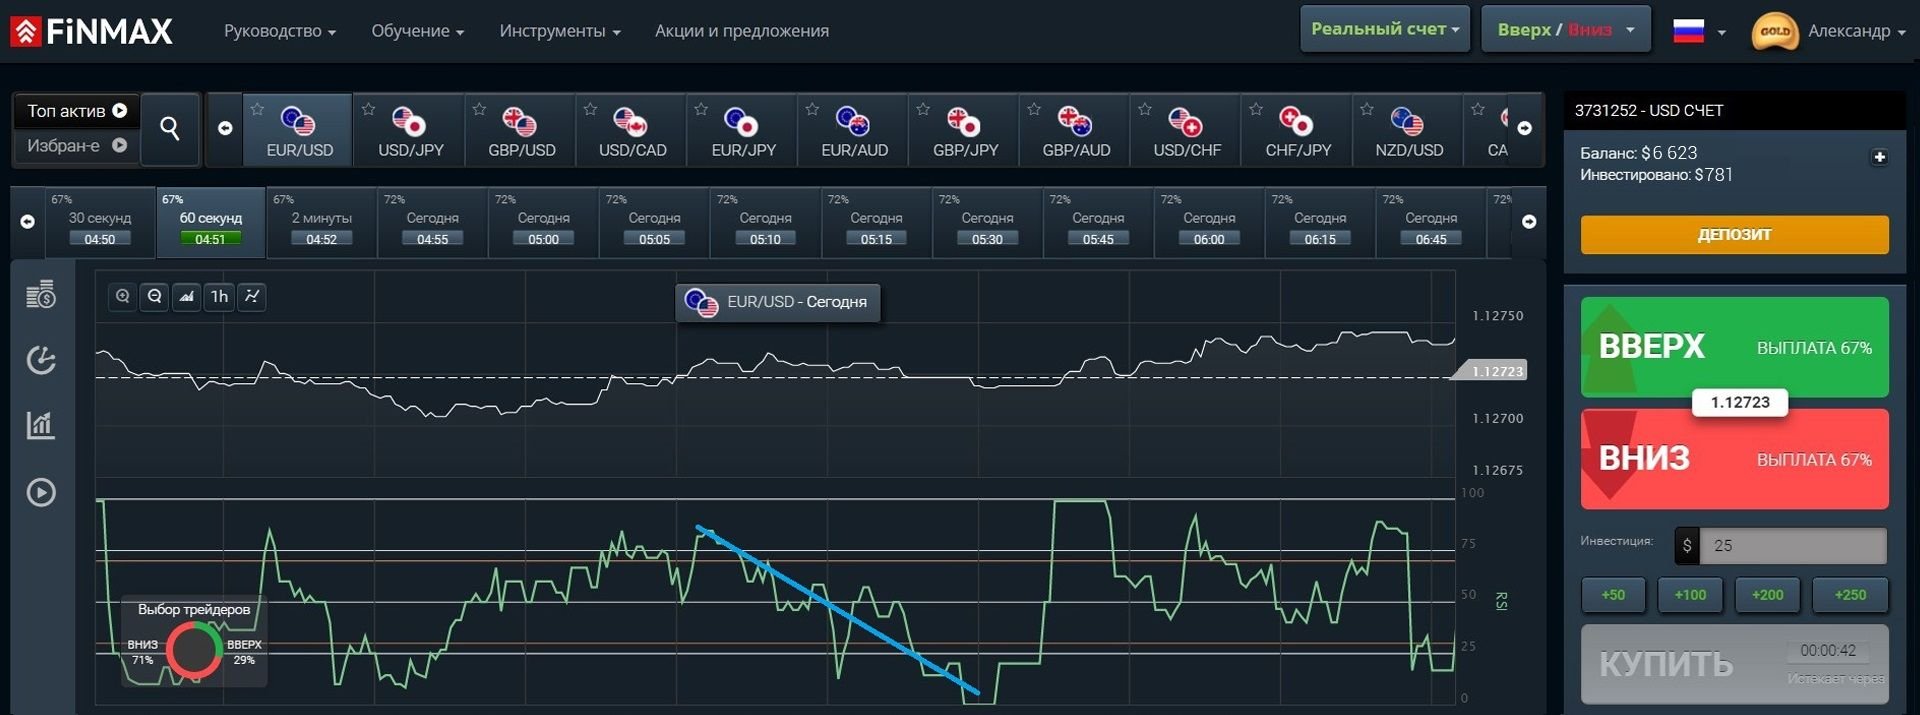
If the RSI line is located at the 70 mark, we have an overbought zone in front of us, a signal to sell a PUT option. In the image below, you can observe the downward trend of the market on the platform of the FinMax broker:
You can place a PUT (down) bet with a Finmax broker. To do this, go to the broker’s website finmaxbo.com and prepare an option:
- Option
- Expiration
- Amount
- Movement forecast: DOWN
- Then it remains to click on the “buy” button and wait for the results of the forecast.
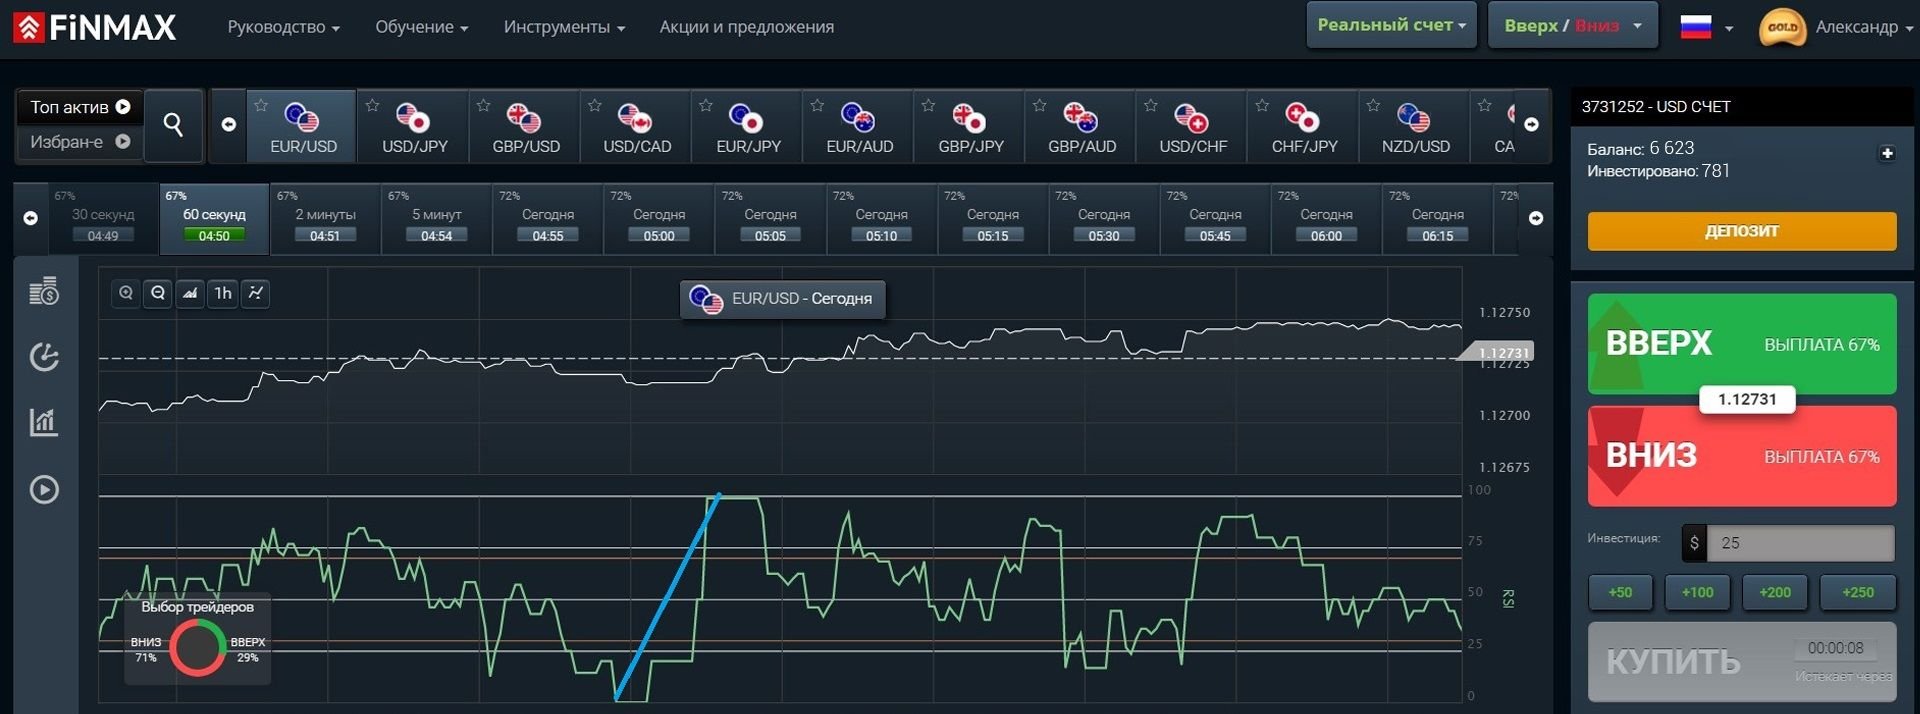
If the RSI value is at 30, this is an oversold zone and a signal to buy a call option. In the image below, you can observe the upward trend of the market on the FinMax broker platform:
You can place a CALL ( up) bet with the Finmax broker. To do this, go to the broker’s website finmaxbo.com and prepare an option:
- Option
- Expiration
- Amount
- Movement forecast: UP
- Then it remains to click on the “buy” button and wait for the results of the forecast.
Benefits of RSI
Despite the fact that RSI is more than 40 years old, it is more relevant than ever today. Despite the fact that there are more and more indicators, especially modified versions, RSI is a tool that is difficult to replace with any modern oscillator. It works great in side flats, as well as in various strategies.
In addition, it is easy and simple to work with it, it is in the arsenal of tools for both professional market players and novice traders. When used correctly, the RSI will provide clues about a potential trend reversal. As part of your profitable strategy, it is capable of generating quality signals that will bring you a good income.
Tagged with: Binary Options Indicator • proximate analysis • RSI